Where Strategy
Meets Execution
A comprehensive, government-grade platform that transforms how organizations define strategy, track KPIs, manage initiatives, and drive measurable results — end to end.
Everything Your Strategy Needs
From defining your vision to recording corrective actions — Rouya 360 covers the complete performance management lifecycle in one connected system.
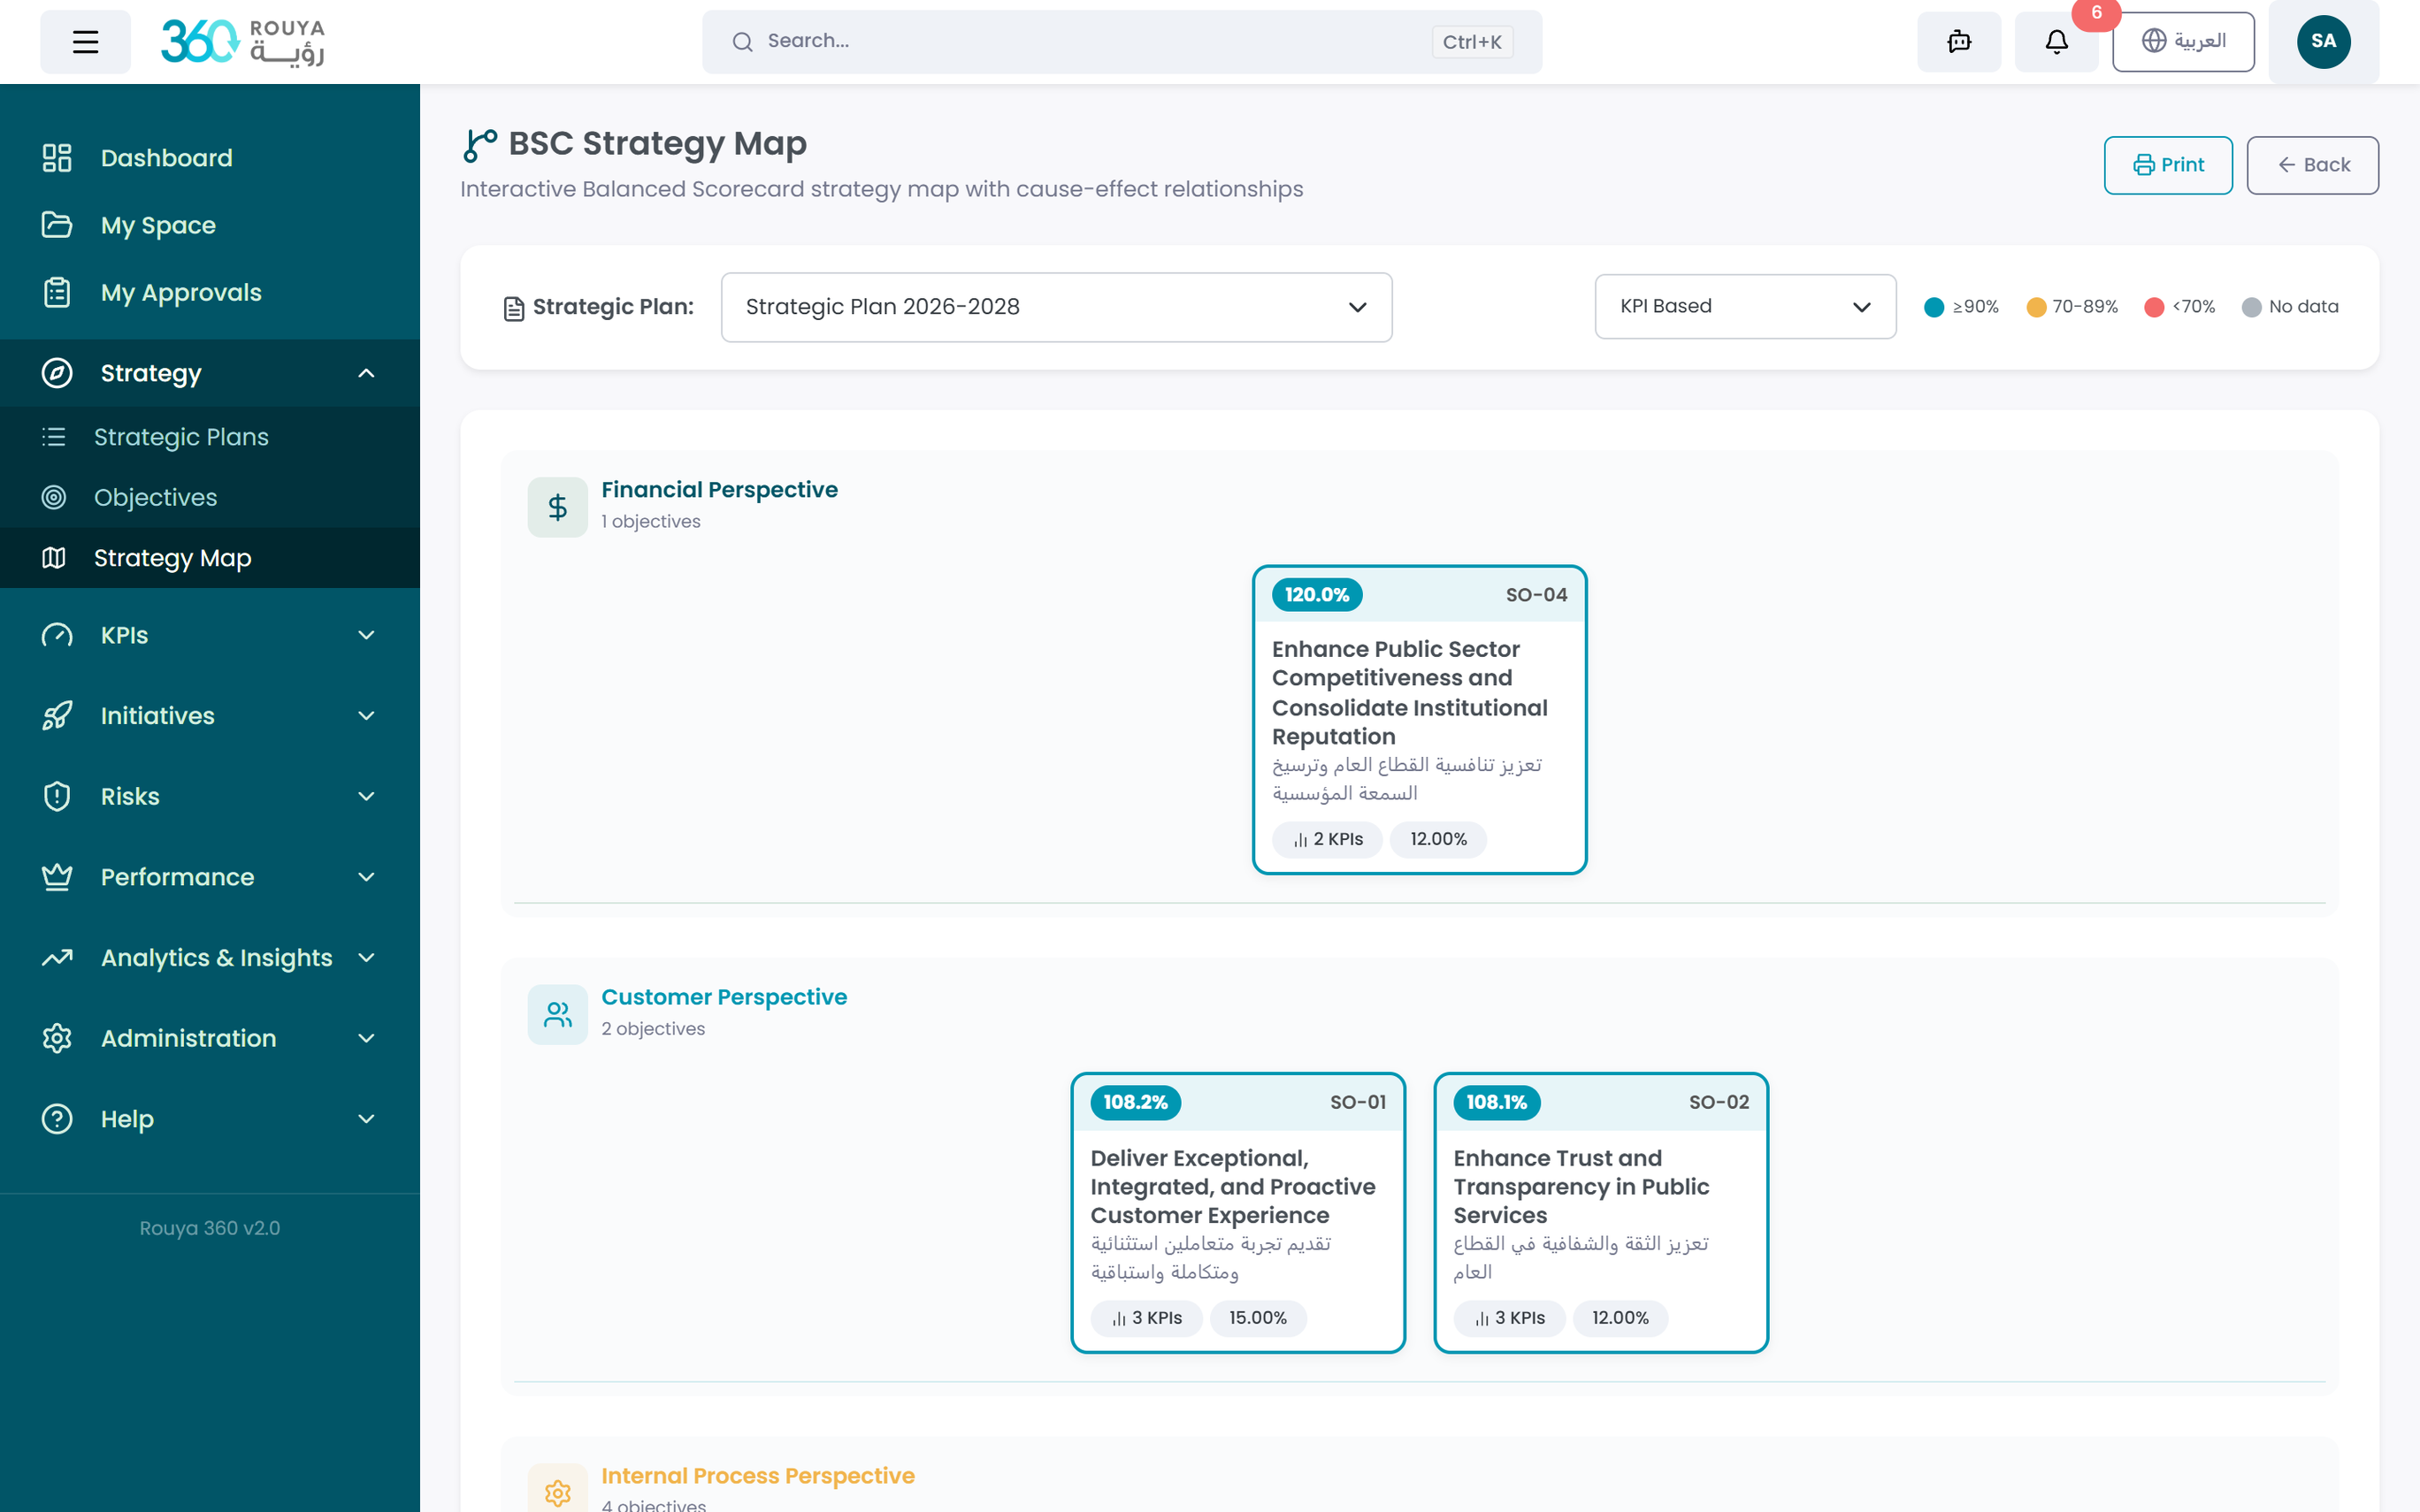
Strategic Architecture
Build your complete strategic hierarchy — Vision, Mission, pillars, main goals, and sub-goals — with full bilingual naming, time periods, and plan type classification. Link every goal to national and government frameworks, define relative priorities, and map partner entities responsible for contributing to each objective.
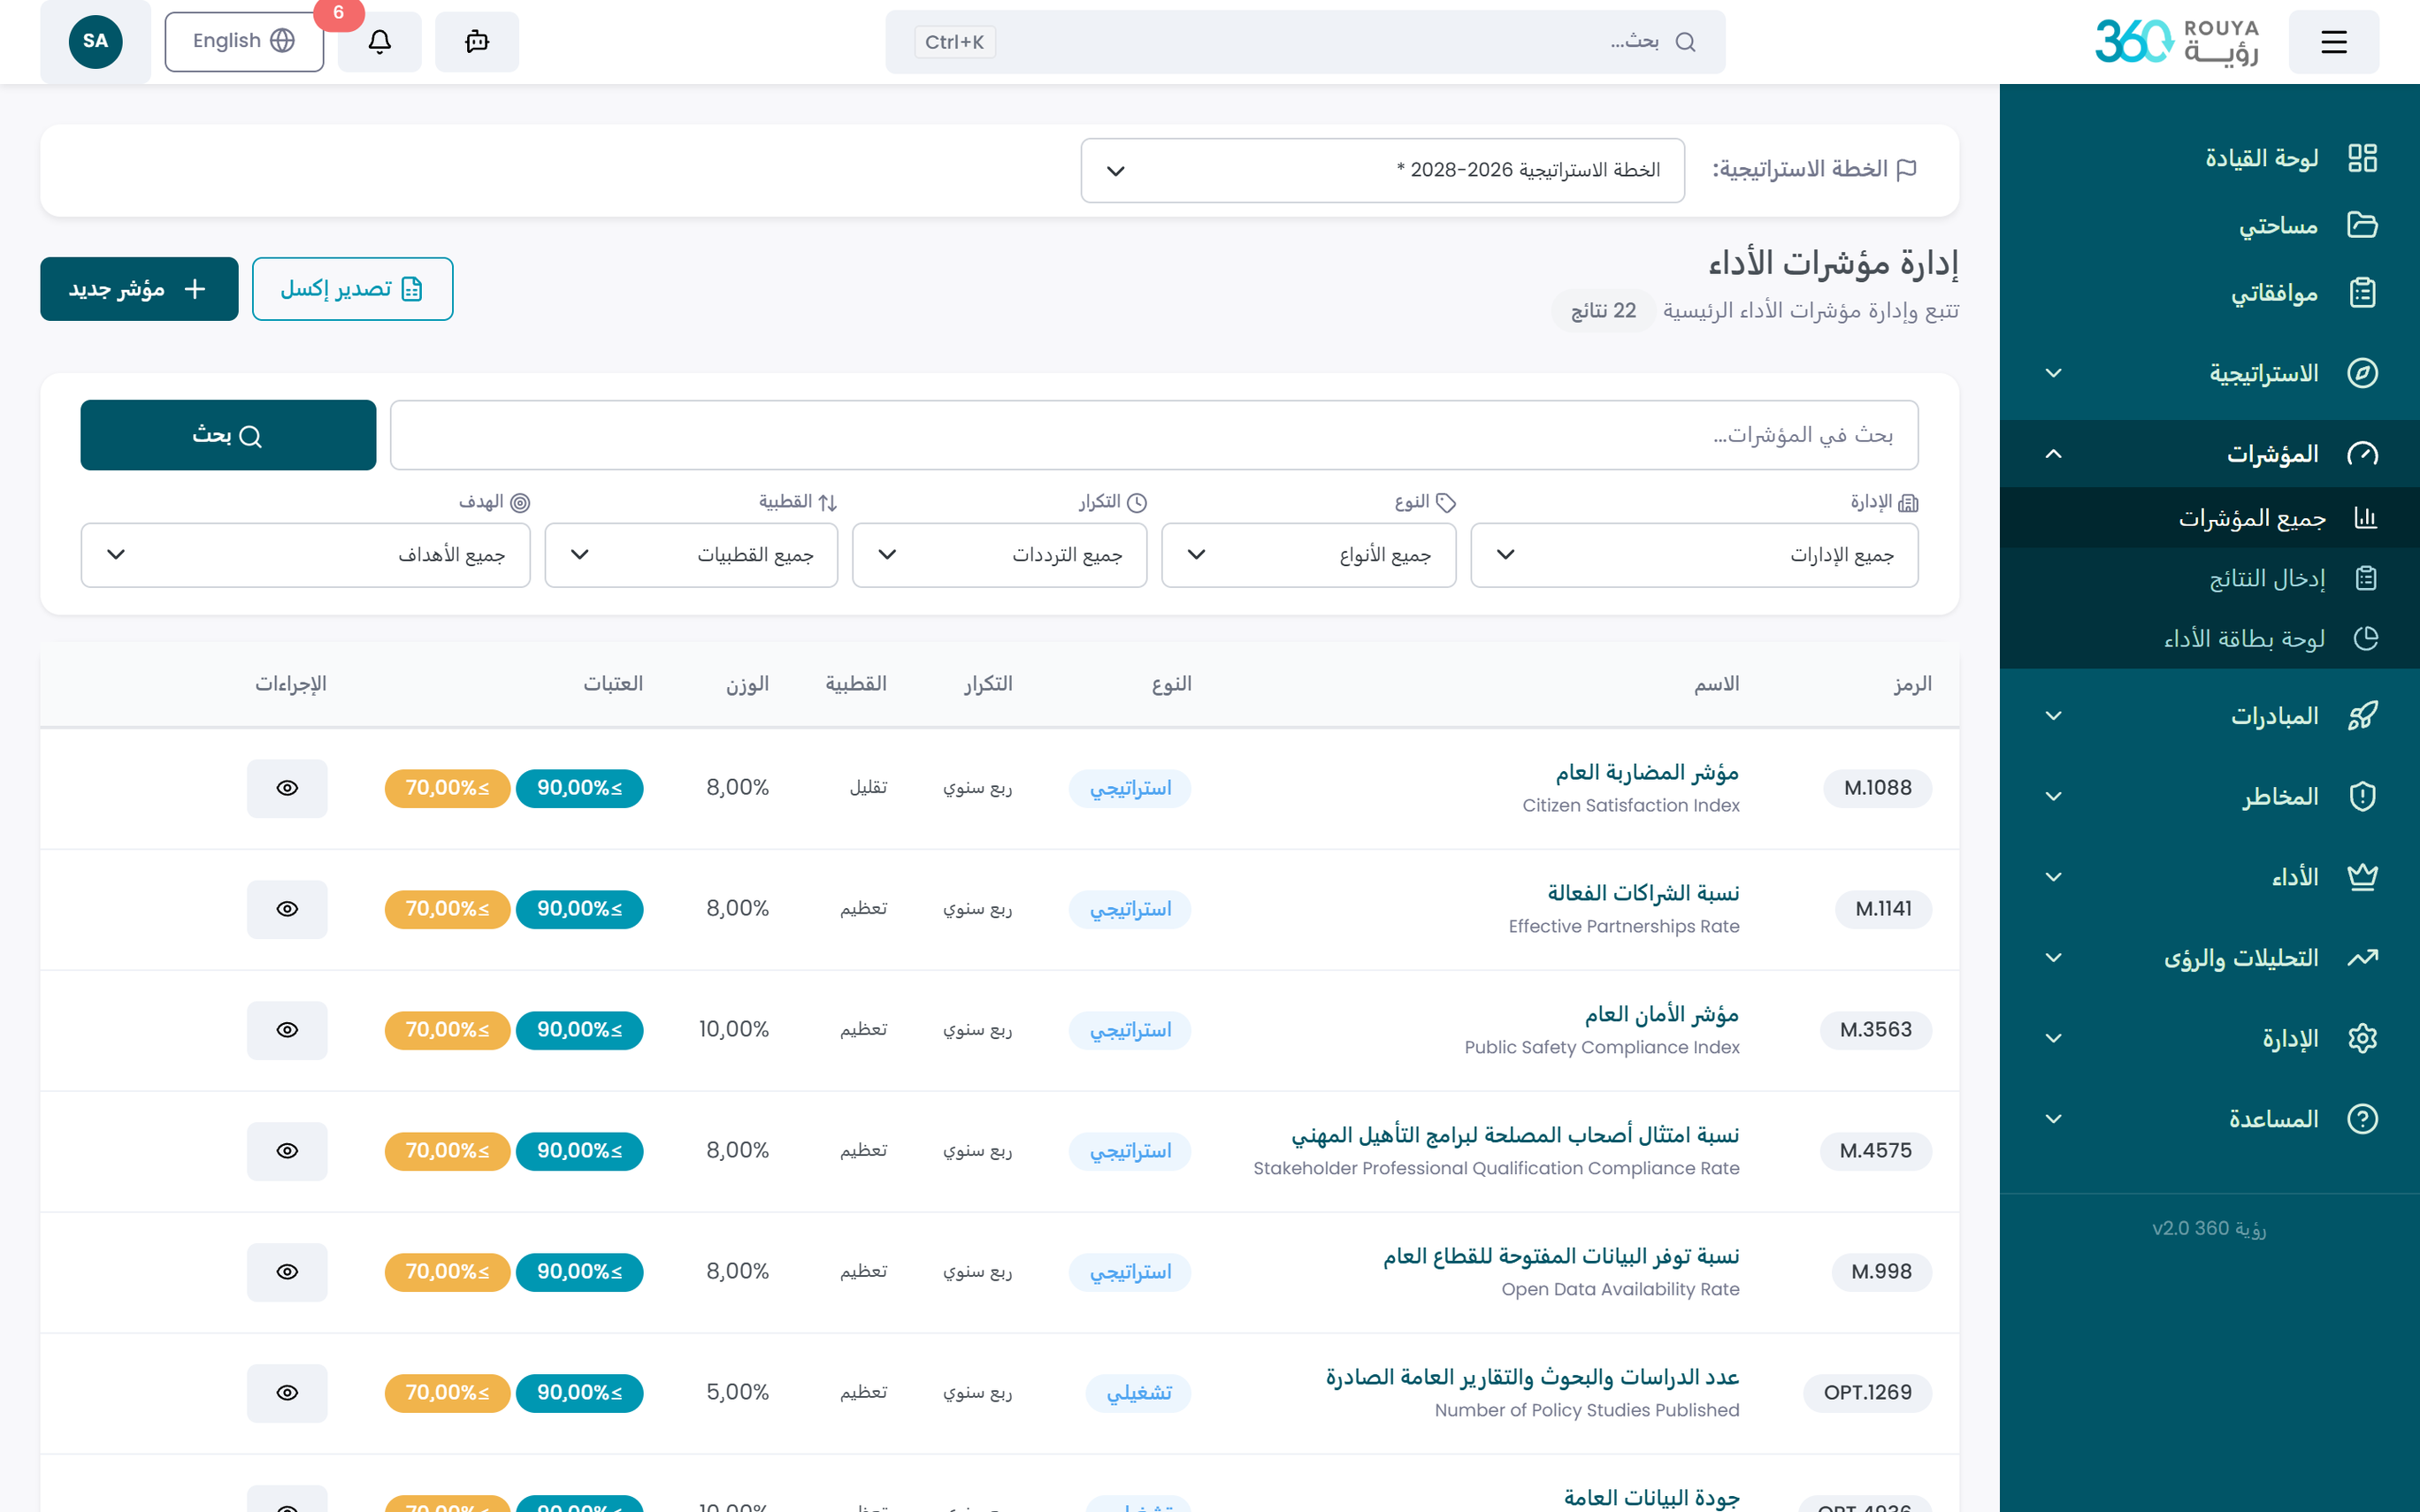
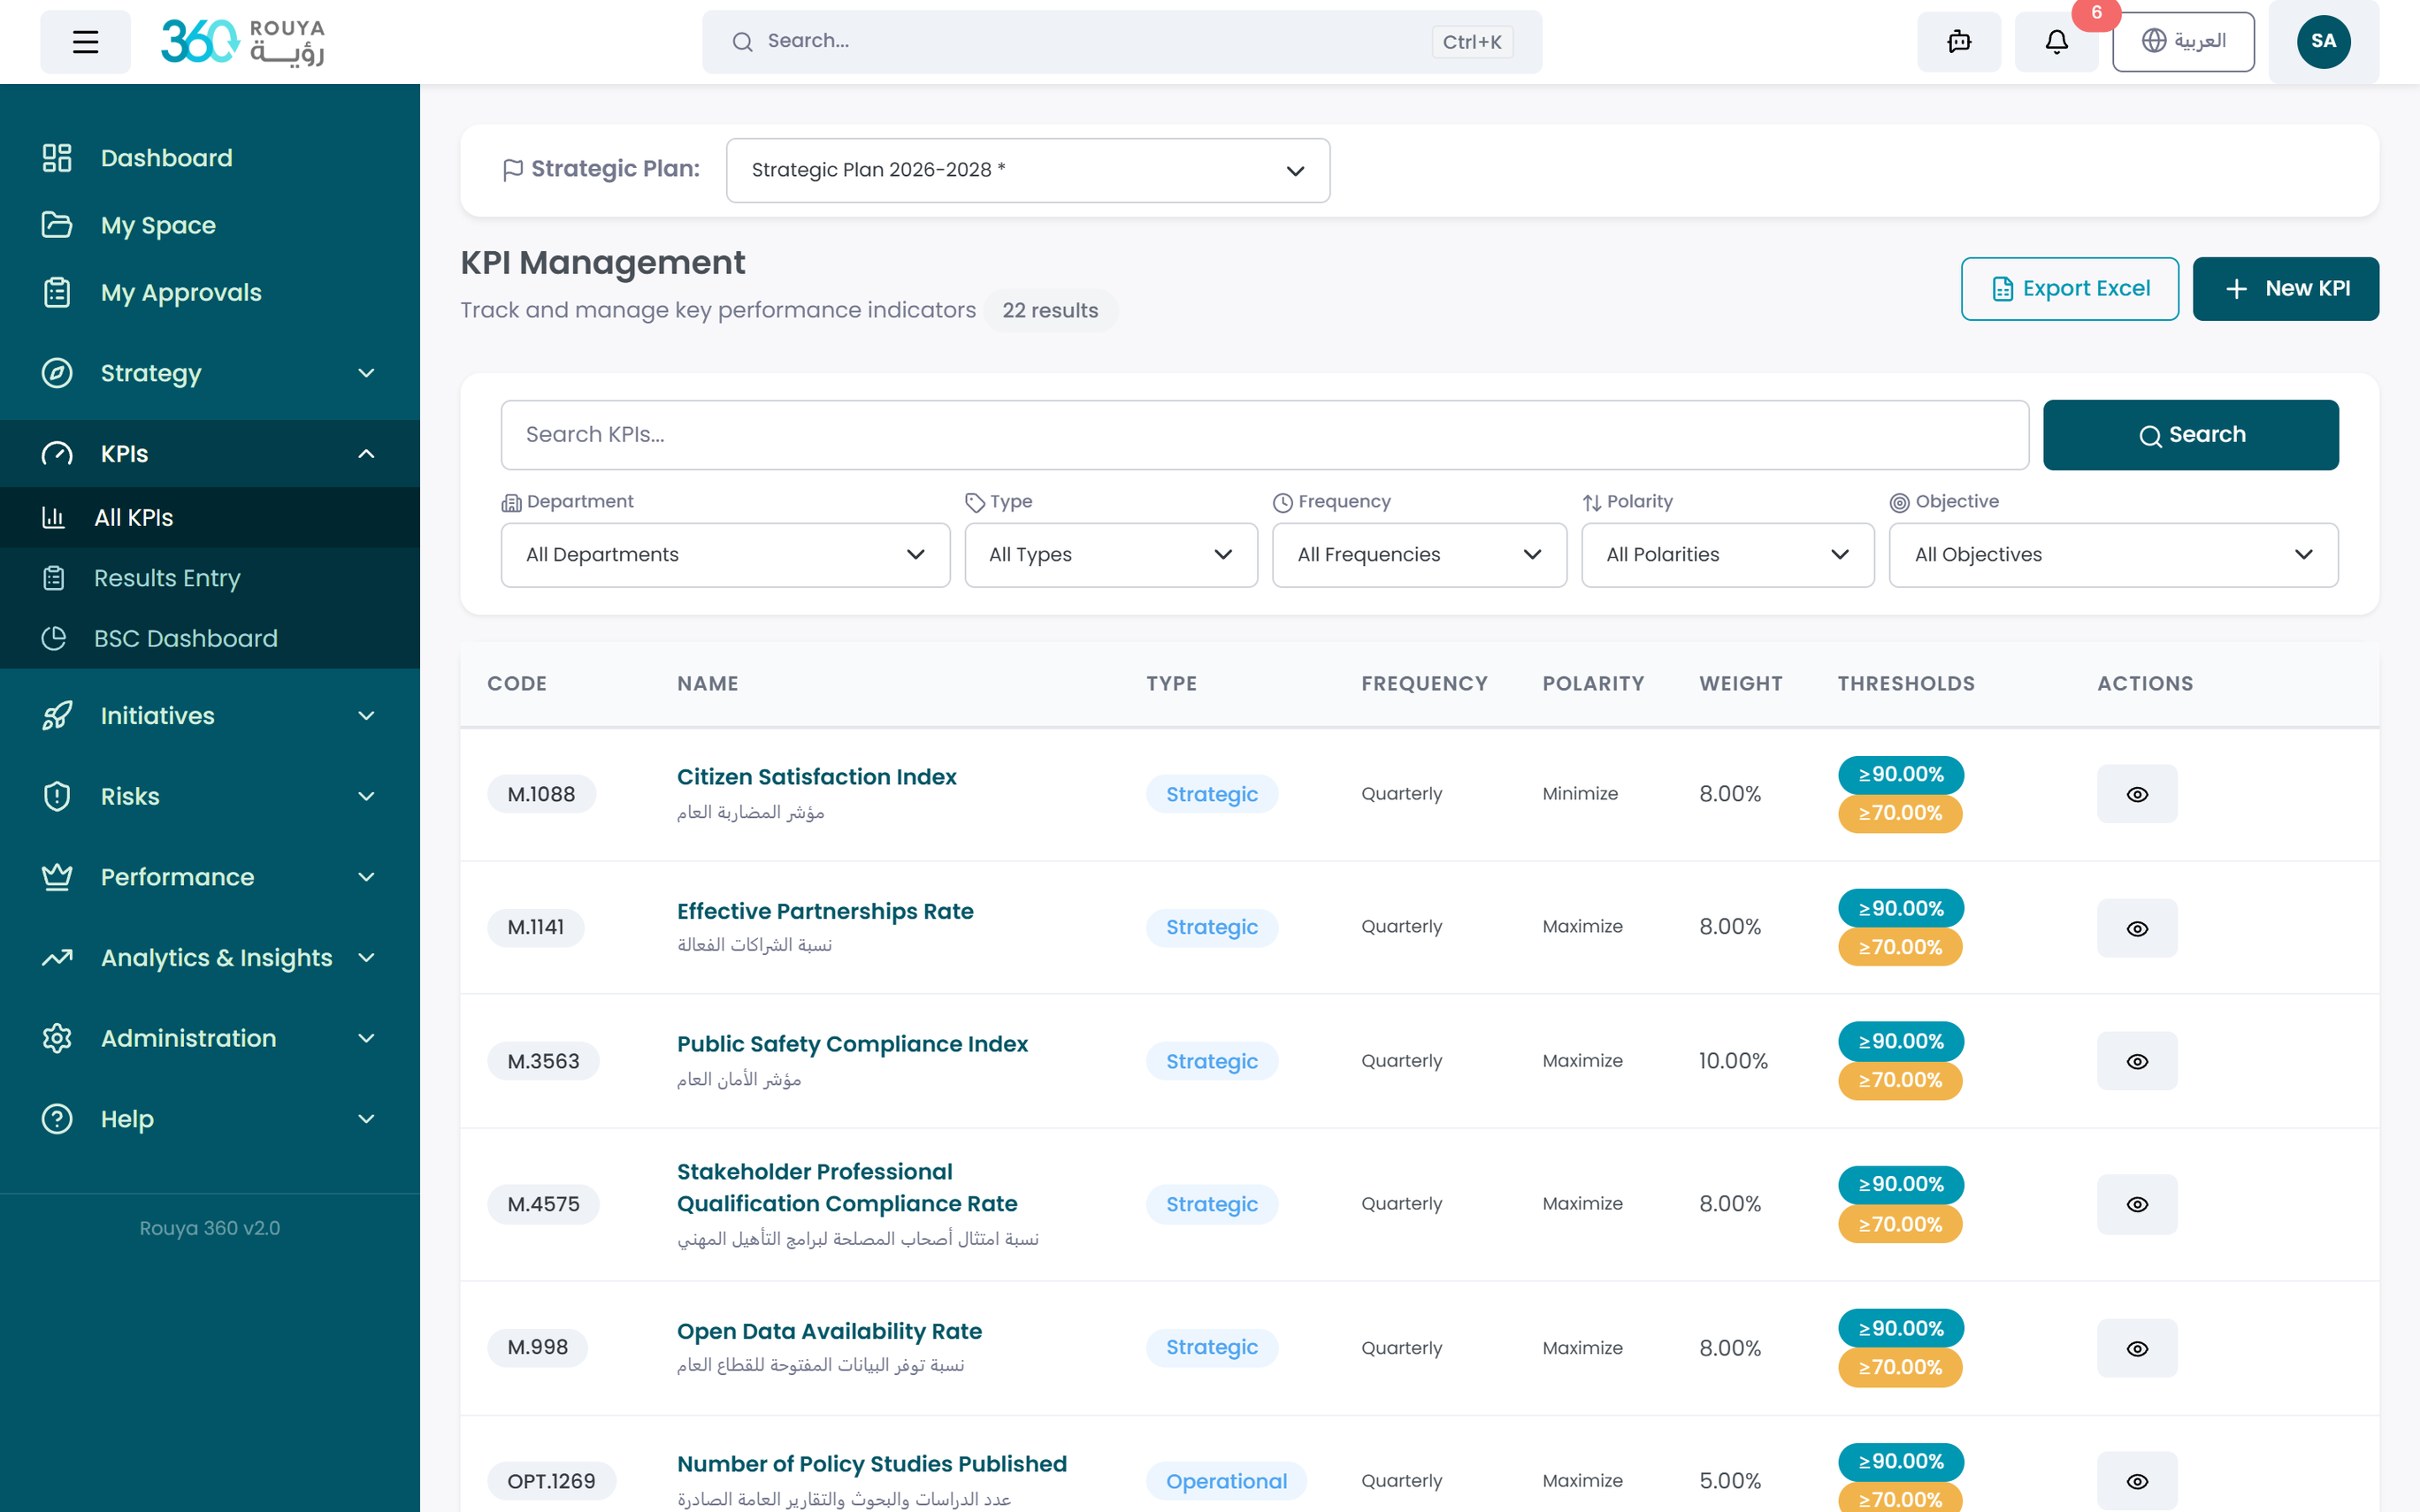
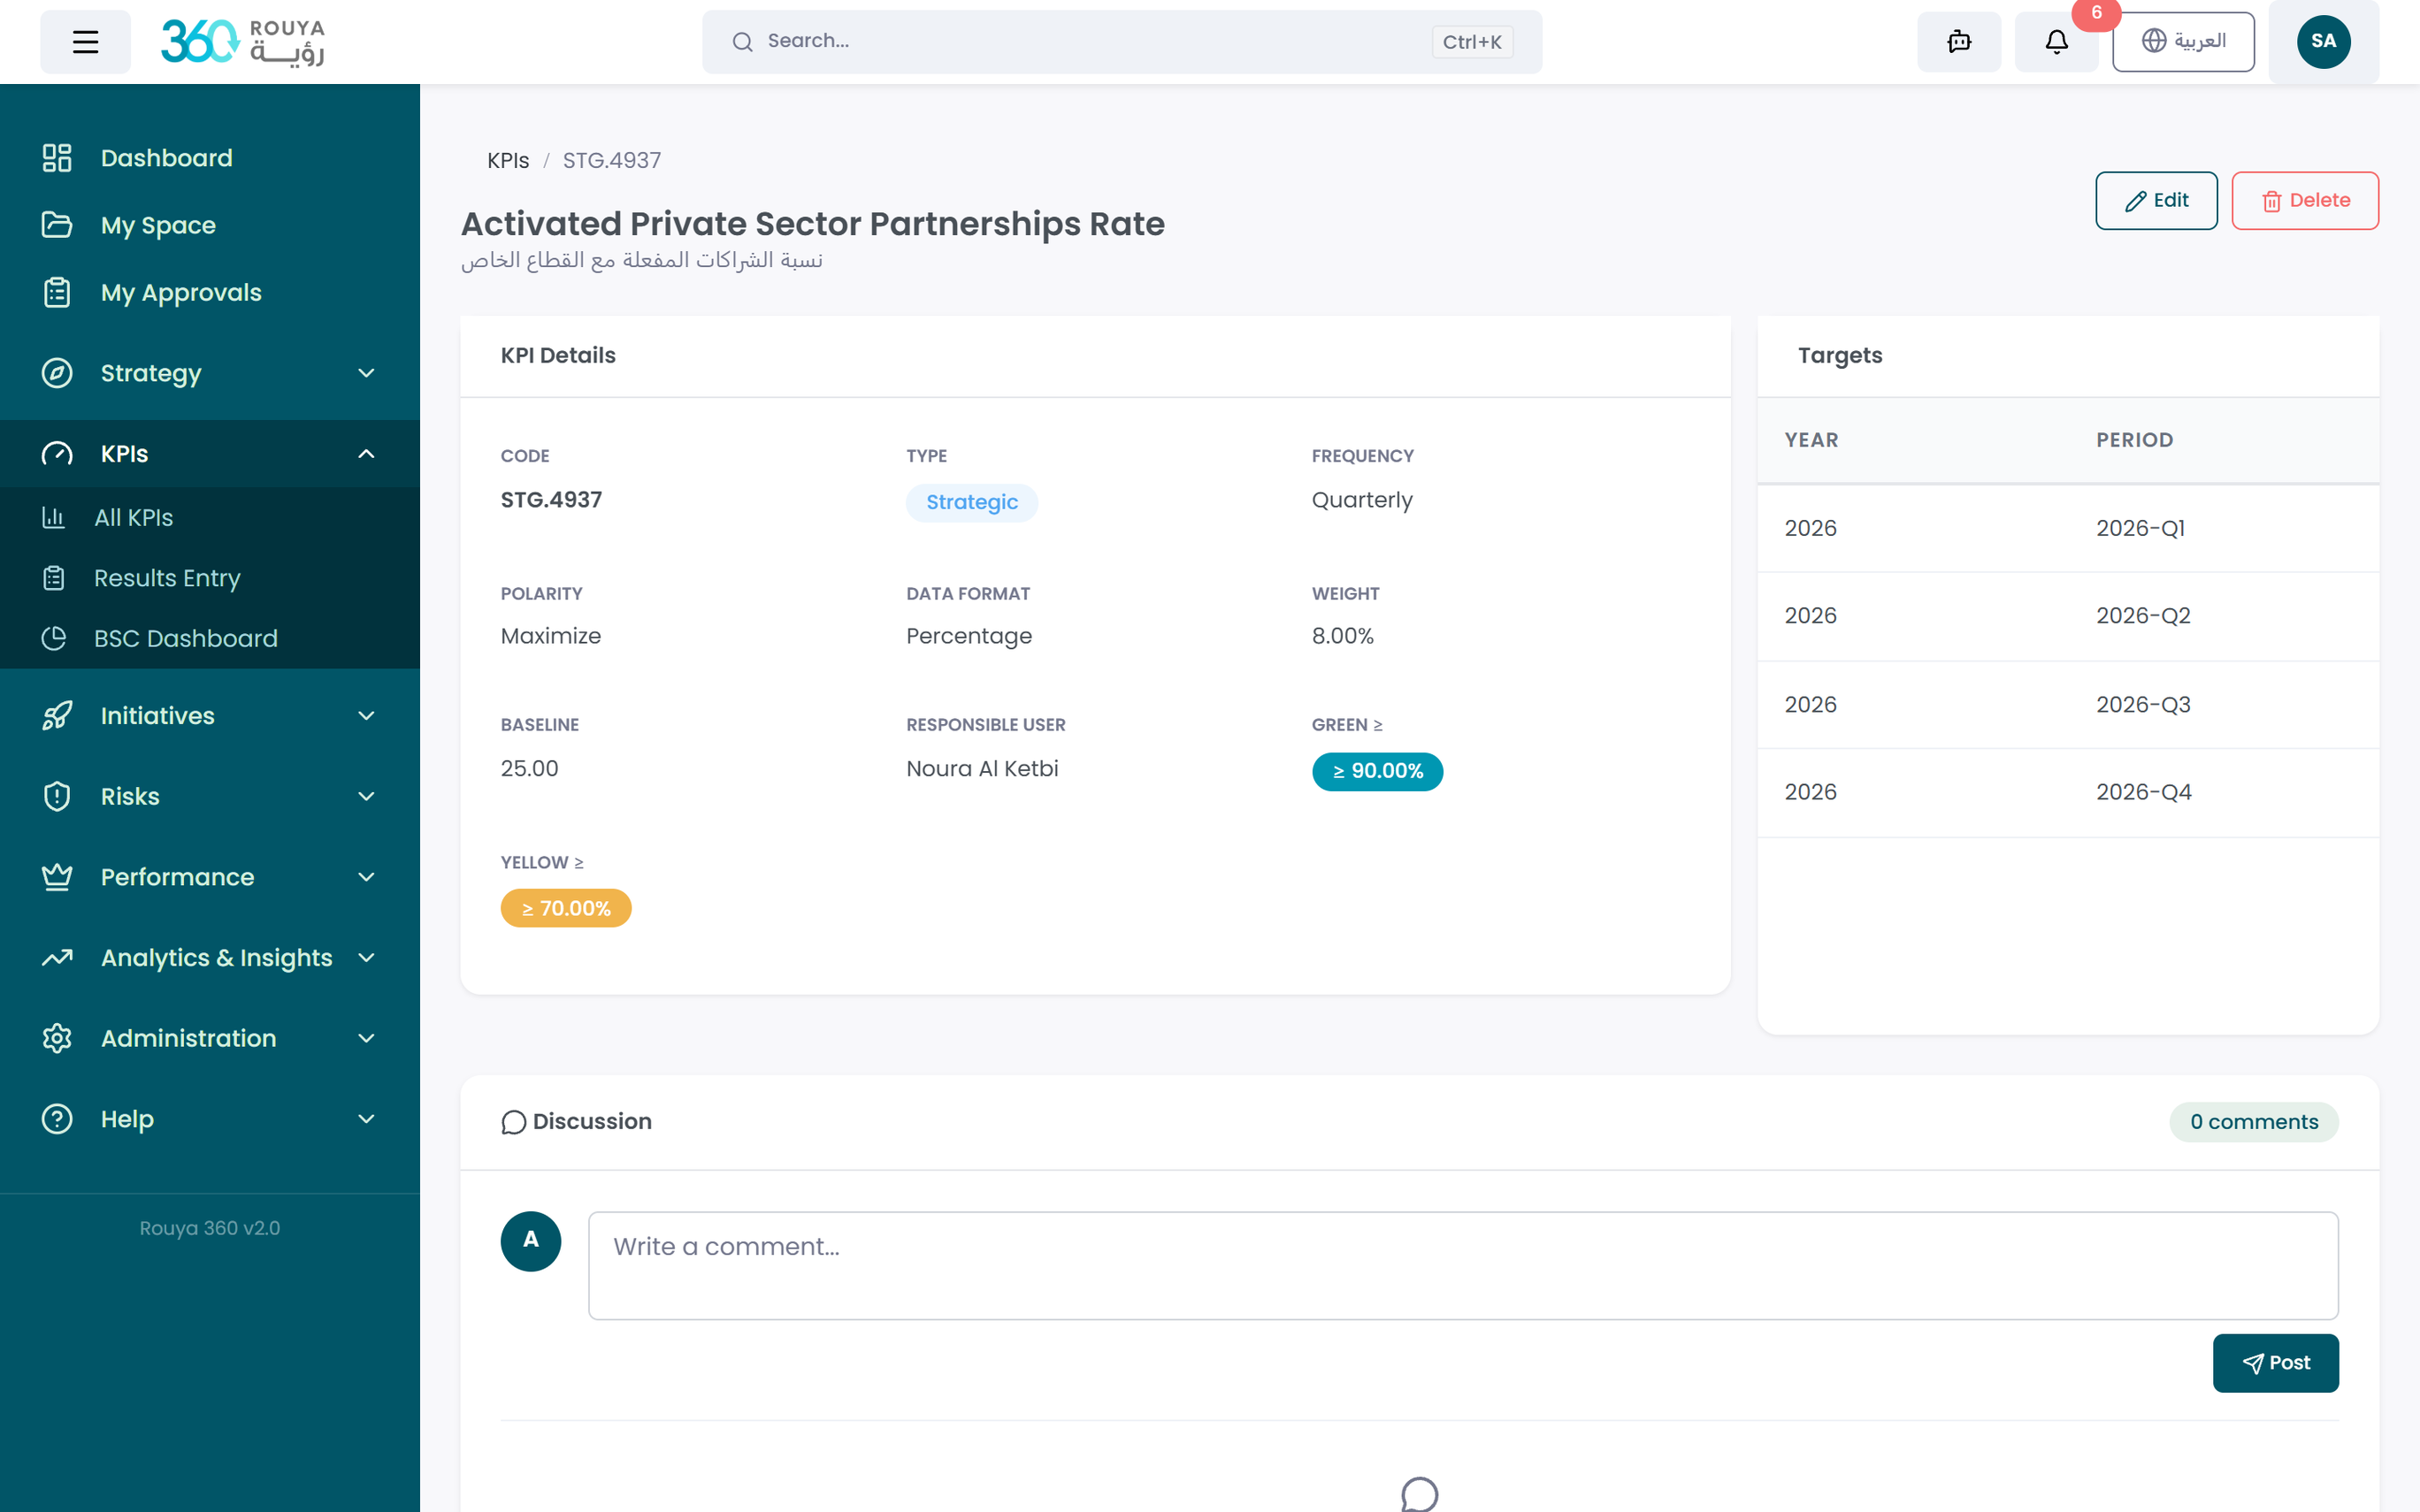
KPI Design & Management
Create comprehensive indicator cards with unique system IDs, measurement formulas, data types, measurement cycles (monthly through biennial), polarity settings (Maximize / Minimize / Target Range), baselines, and international benchmarks. Link each KPI to its organizational owner, related processes, and active risks. Tag each indicator with its data source — manual entry, file import, or API integration — so teams always know where the number came from.
Target Setting
Define upper and lower targets across multiple time horizons — annually, quarterly, or any custom period. Use incremental target definitions or automate generation using linear growth, percentage increase, compound rate, or benchmark-referenced methods. Color-coded achievement bands (Green ≥ 90%, Amber 70–89%, Red < 70%) are fully customizable per indicator.
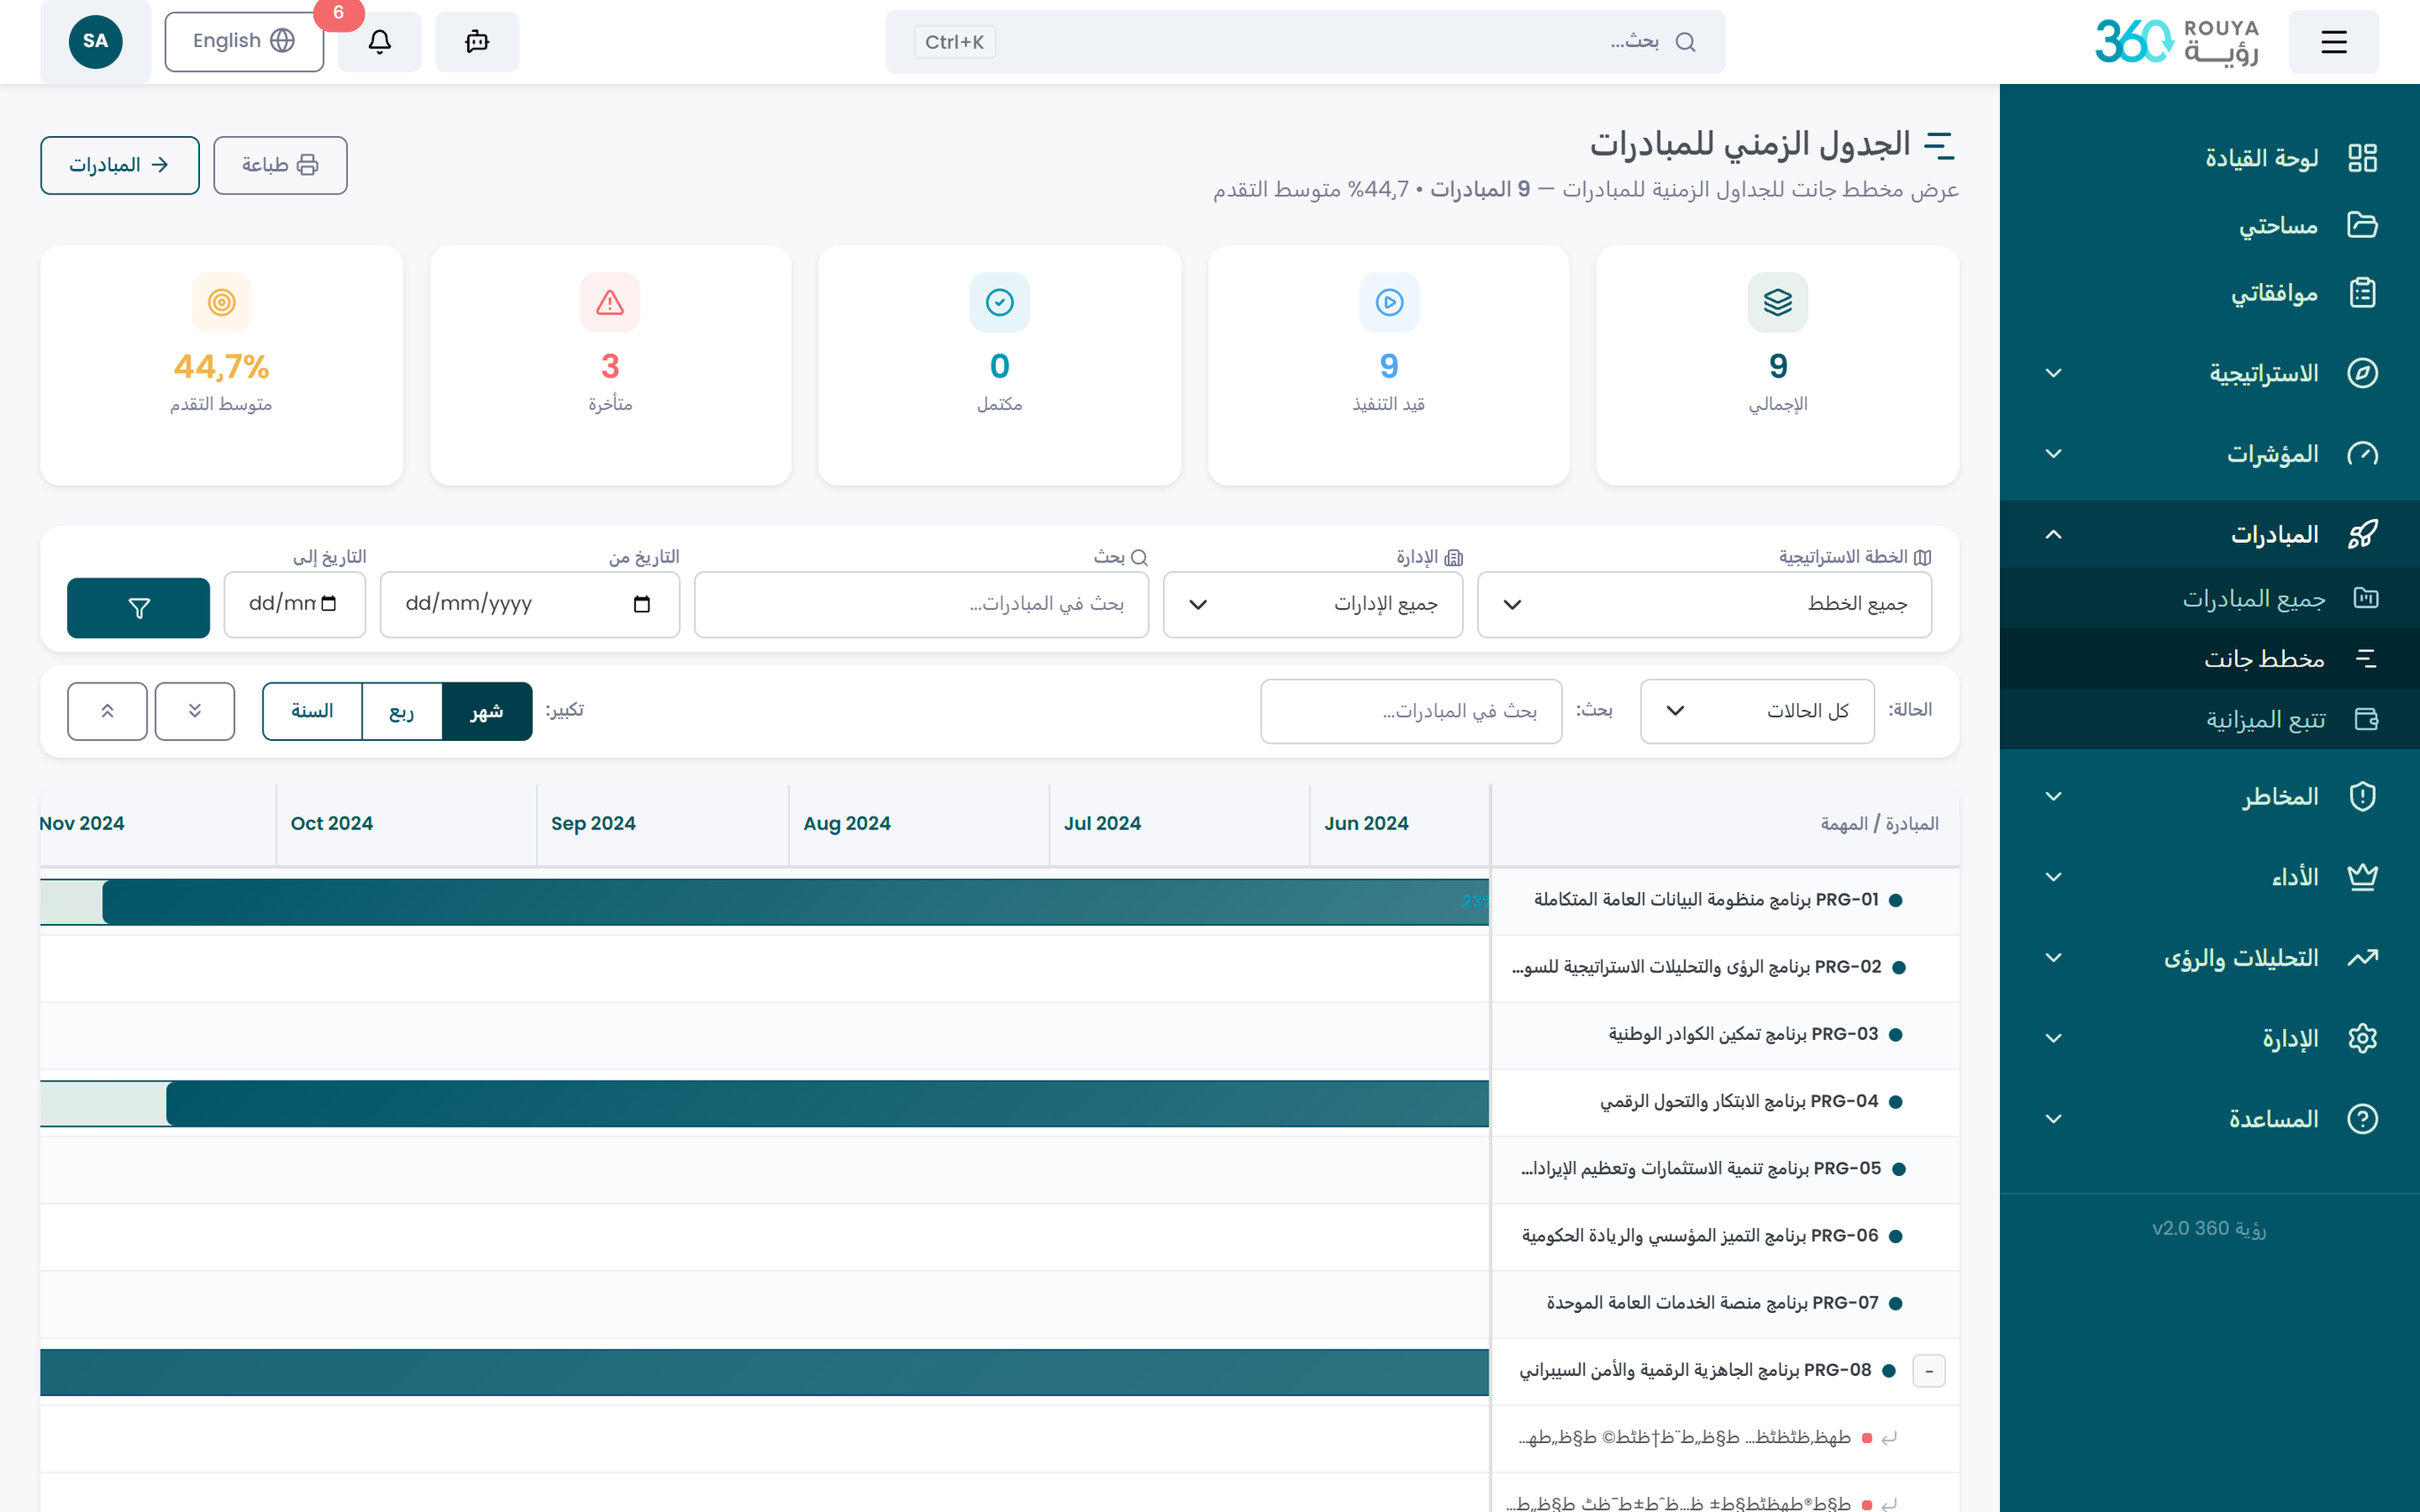
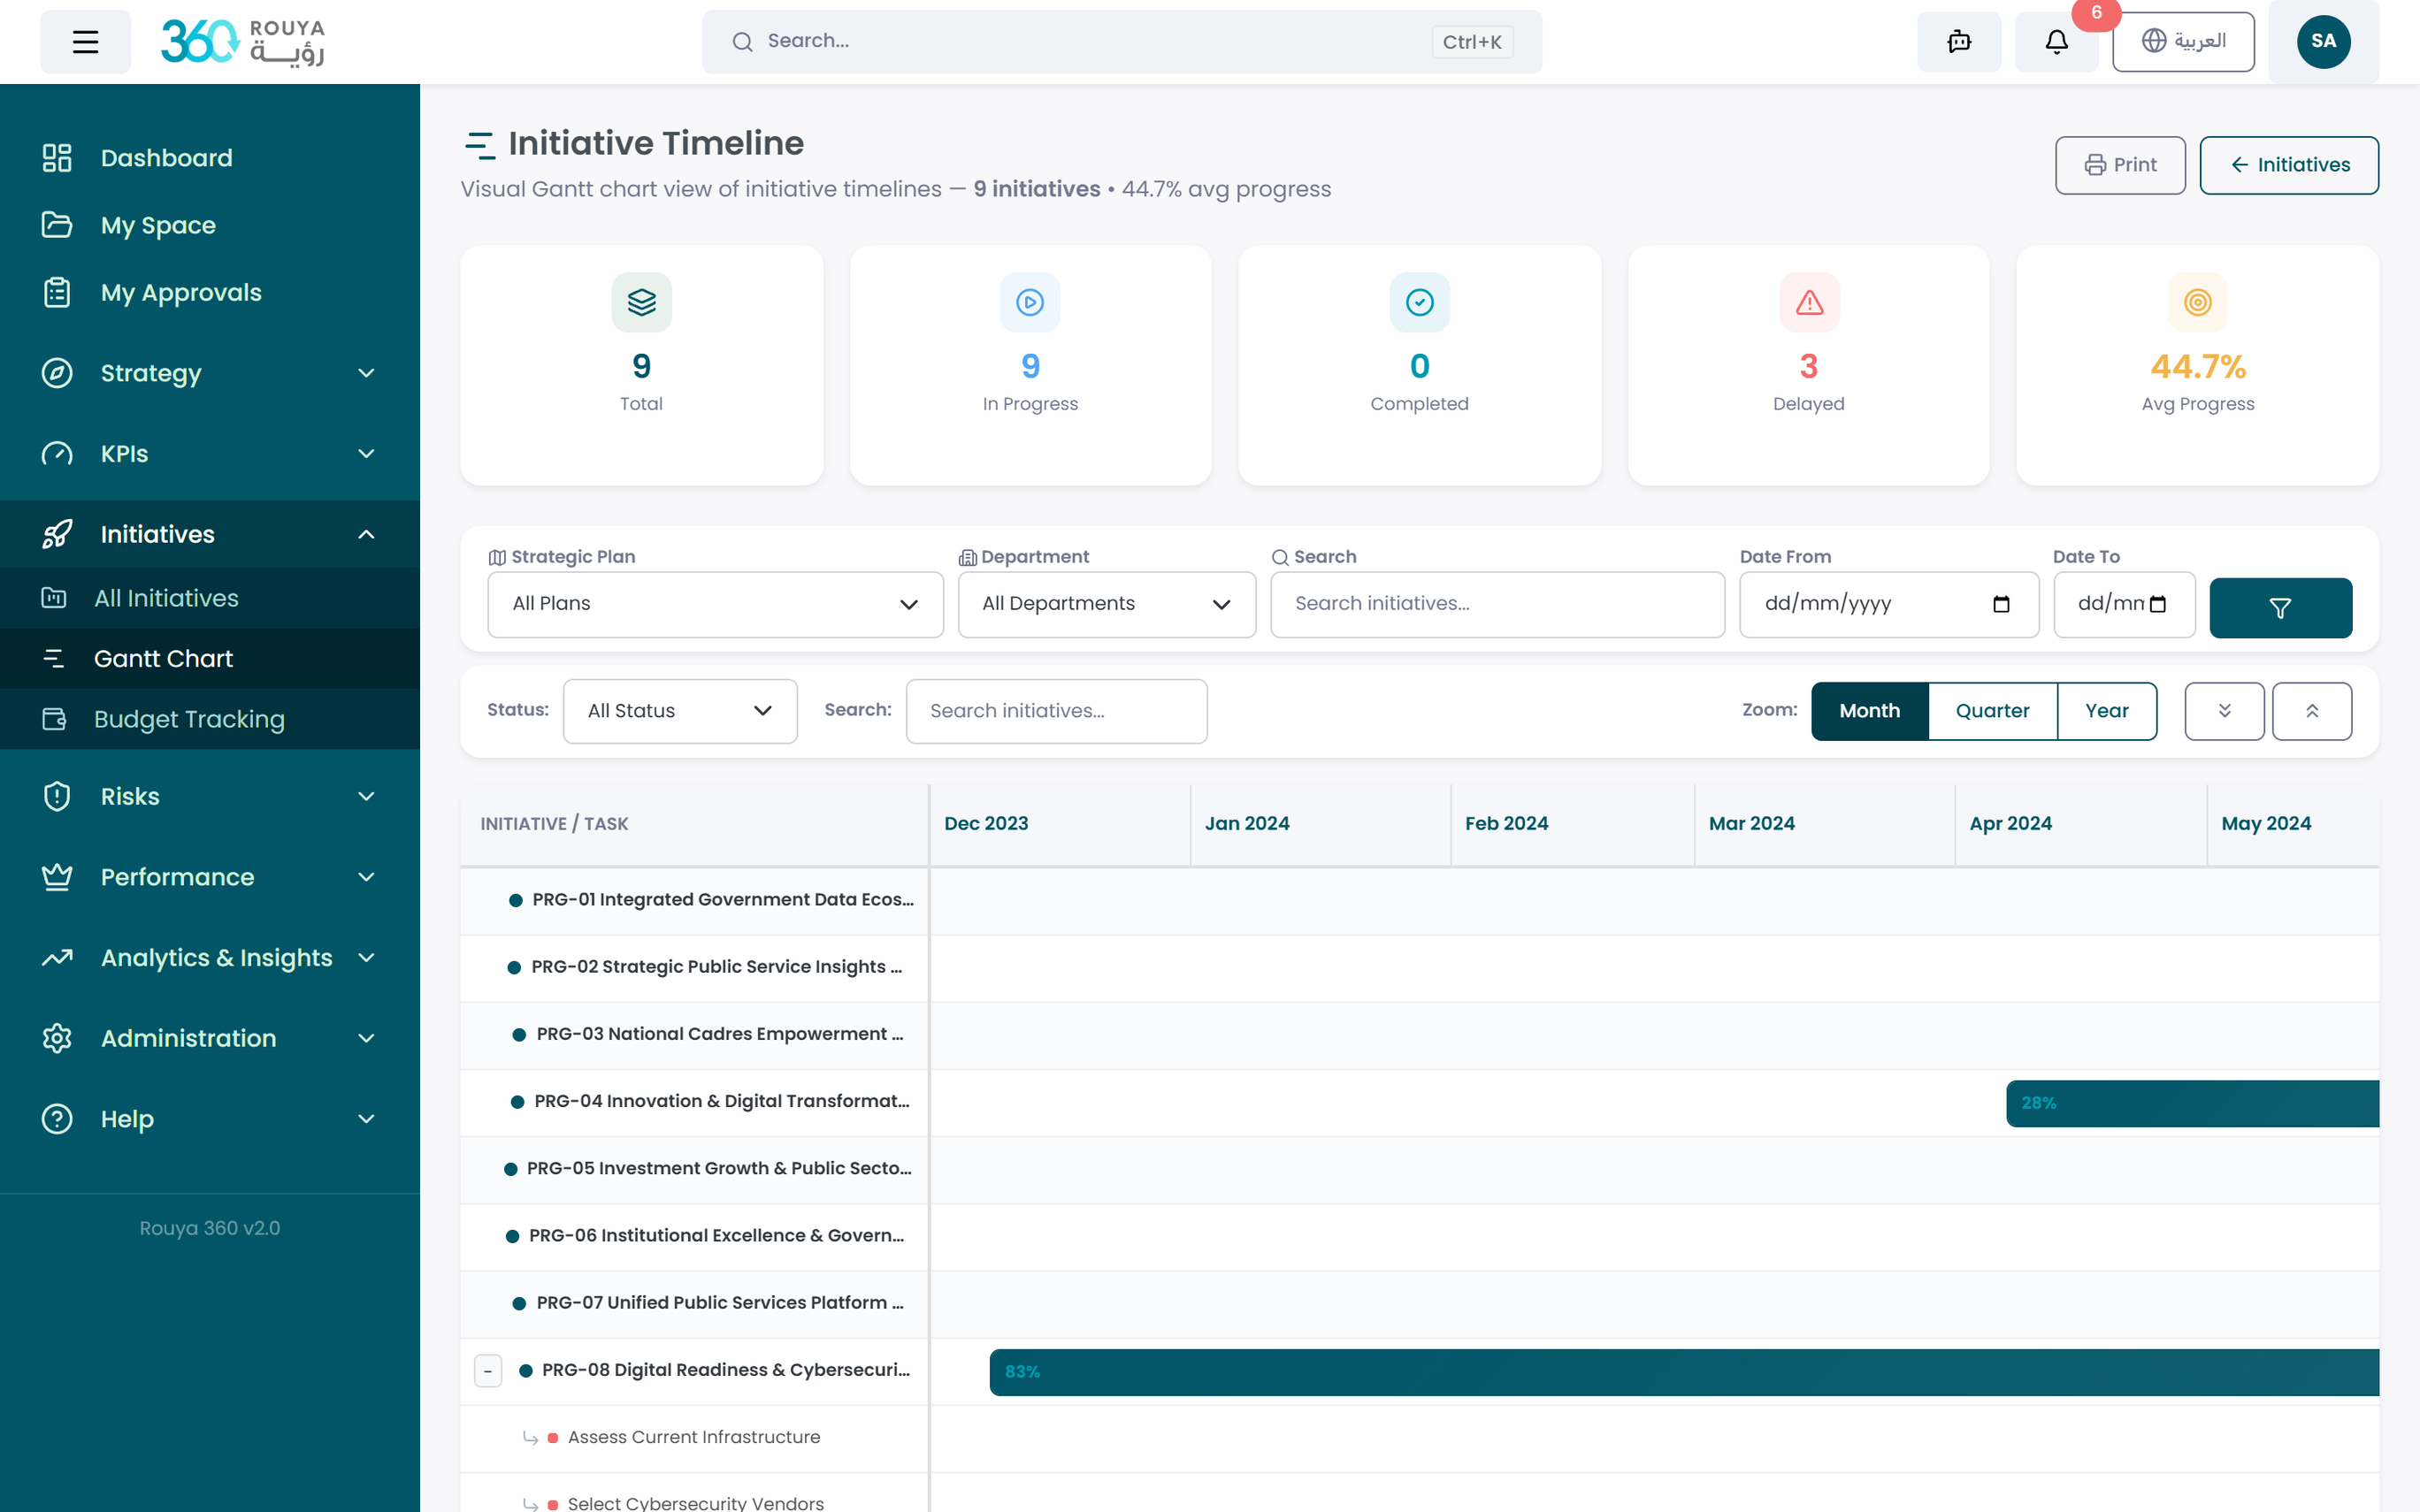
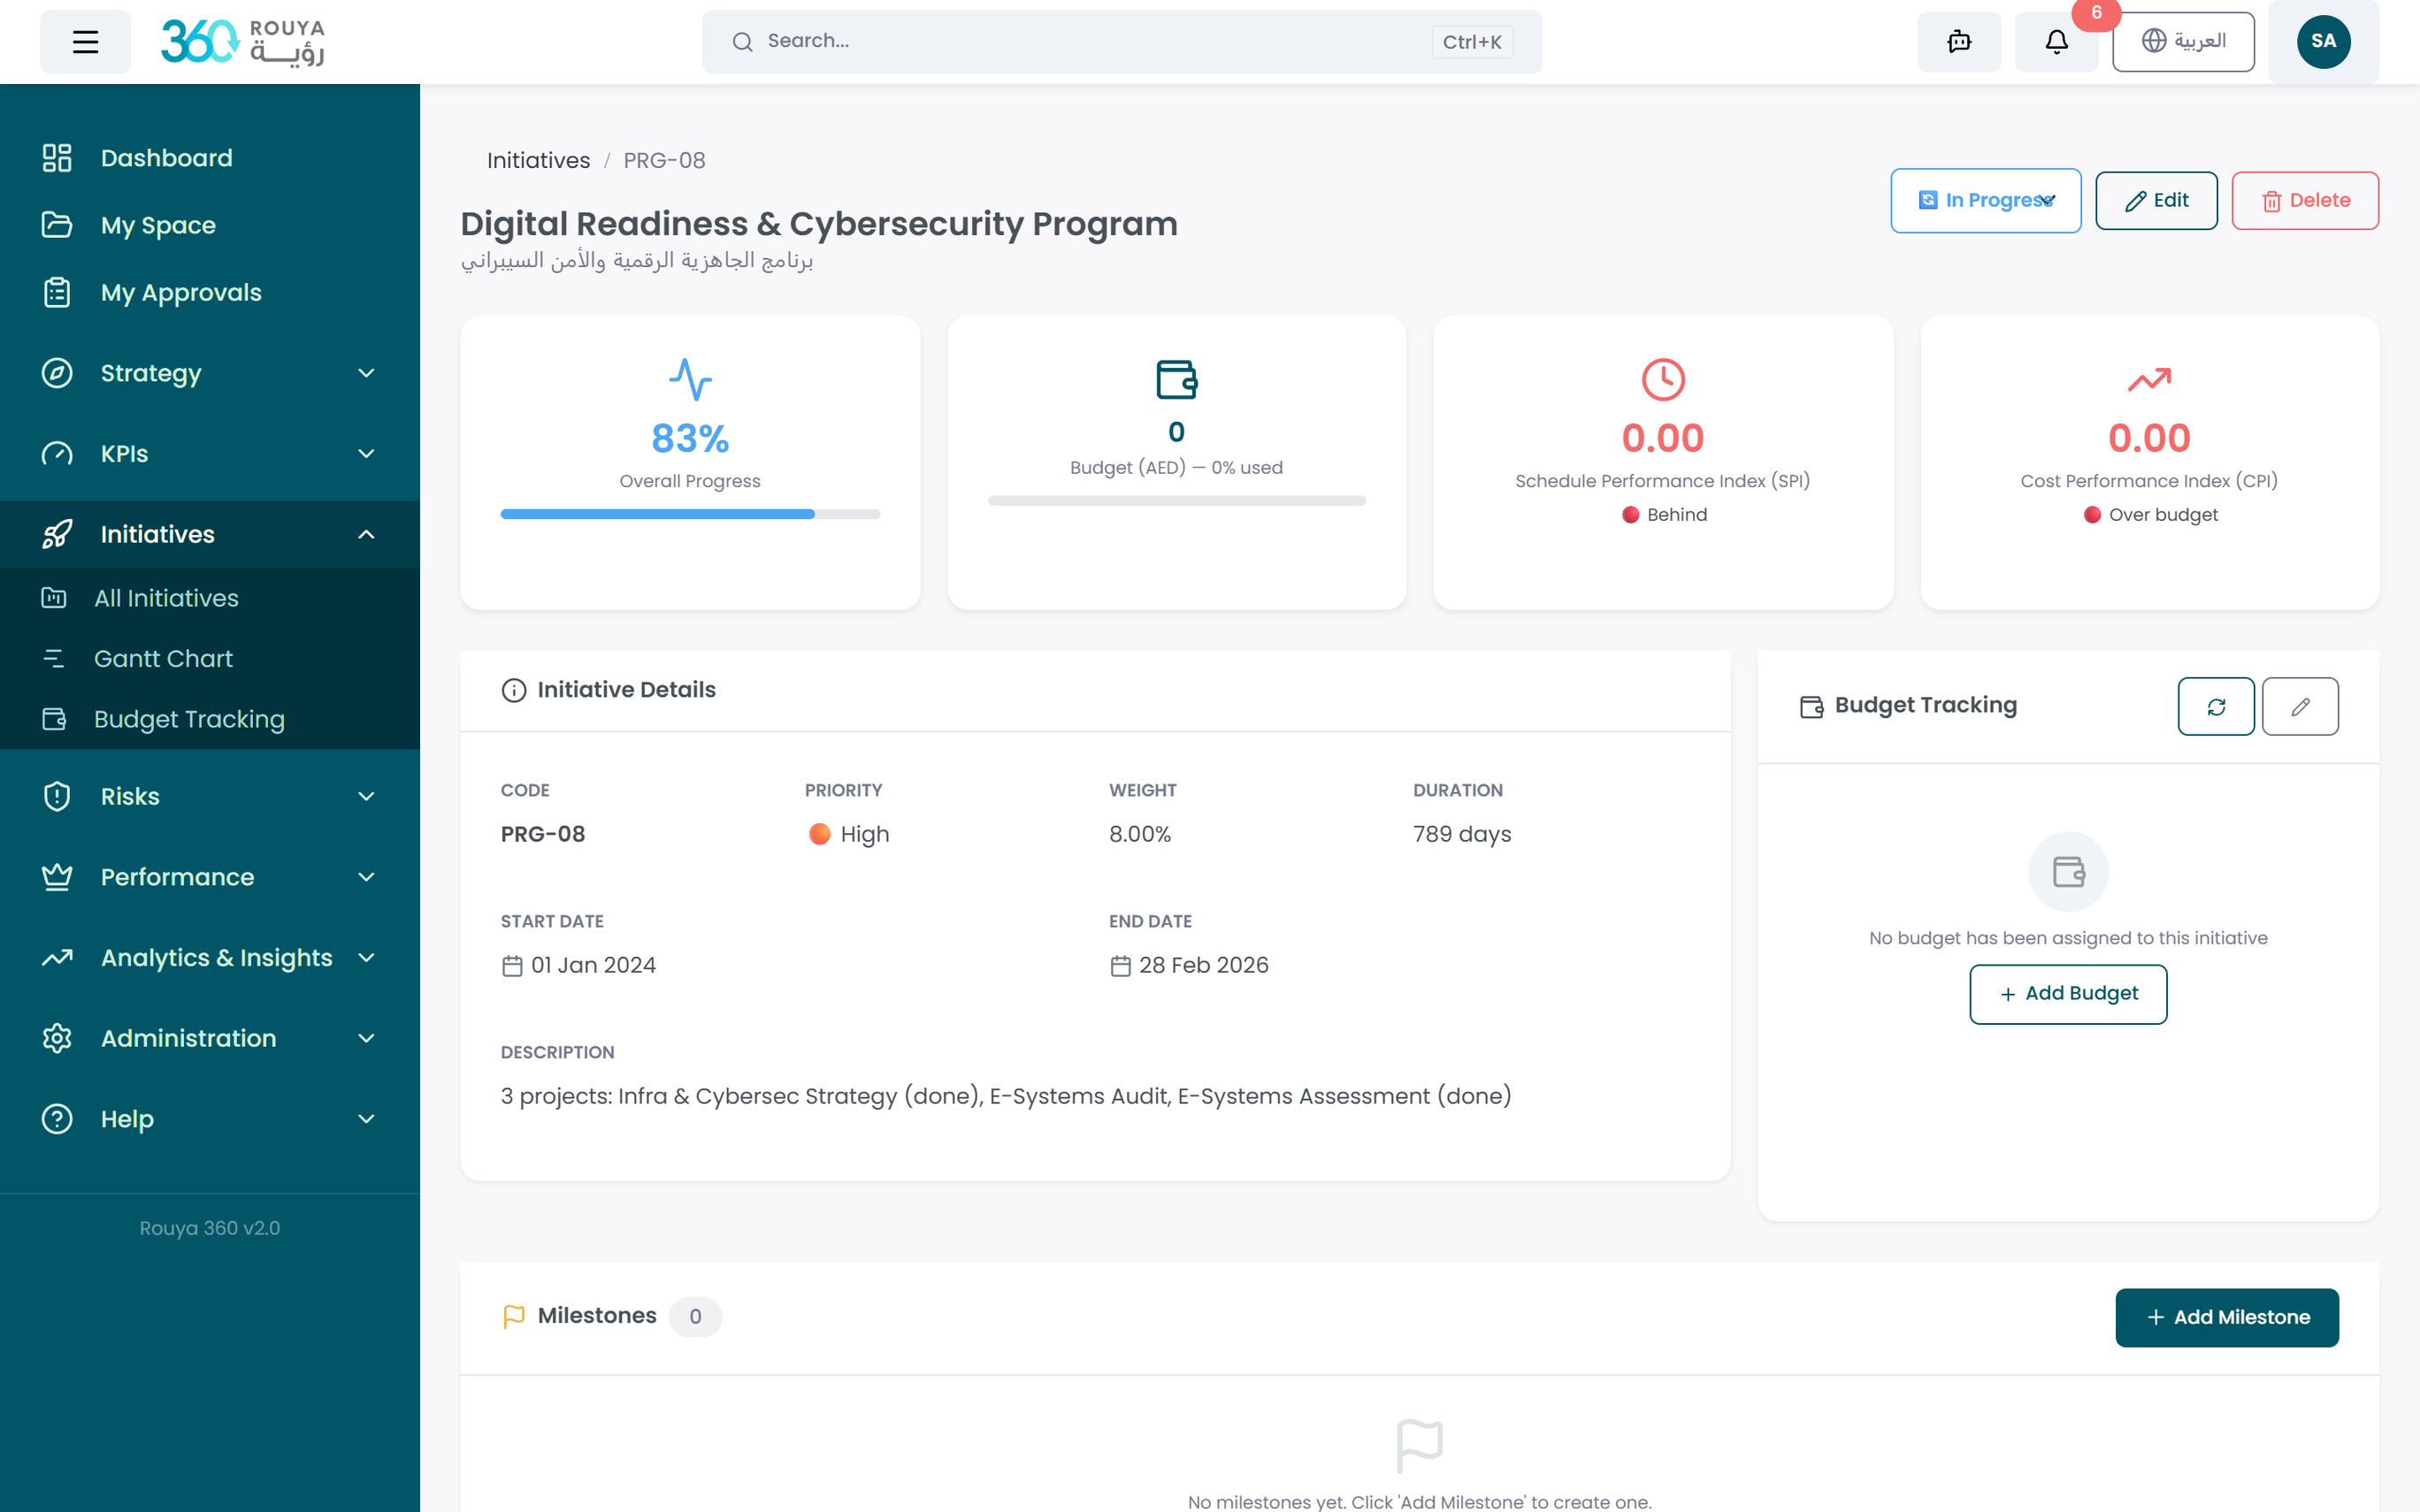
Initiatives & Projects
Register strategic initiatives with full project cards — unique codes, bilingual names, strategic goal linkage, timelines, responsible organizational units, budget allocations, partner entities, and expected deliverables. Break each initiative into phases and tasks, define task dependencies, flag critical-path tasks on a Gantt chart, track completion percentages at every level, and log obstacles with corrective actions taken.
Data Entry & Validation
Open and close measurement periods with controlled access. Data owners enter actuals with causal justifications and supporting evidence. Import from Excel or CSV and upload historical datasets. Enforce data completeness and quality standards before submission — and require corrective actions when targets are not met.
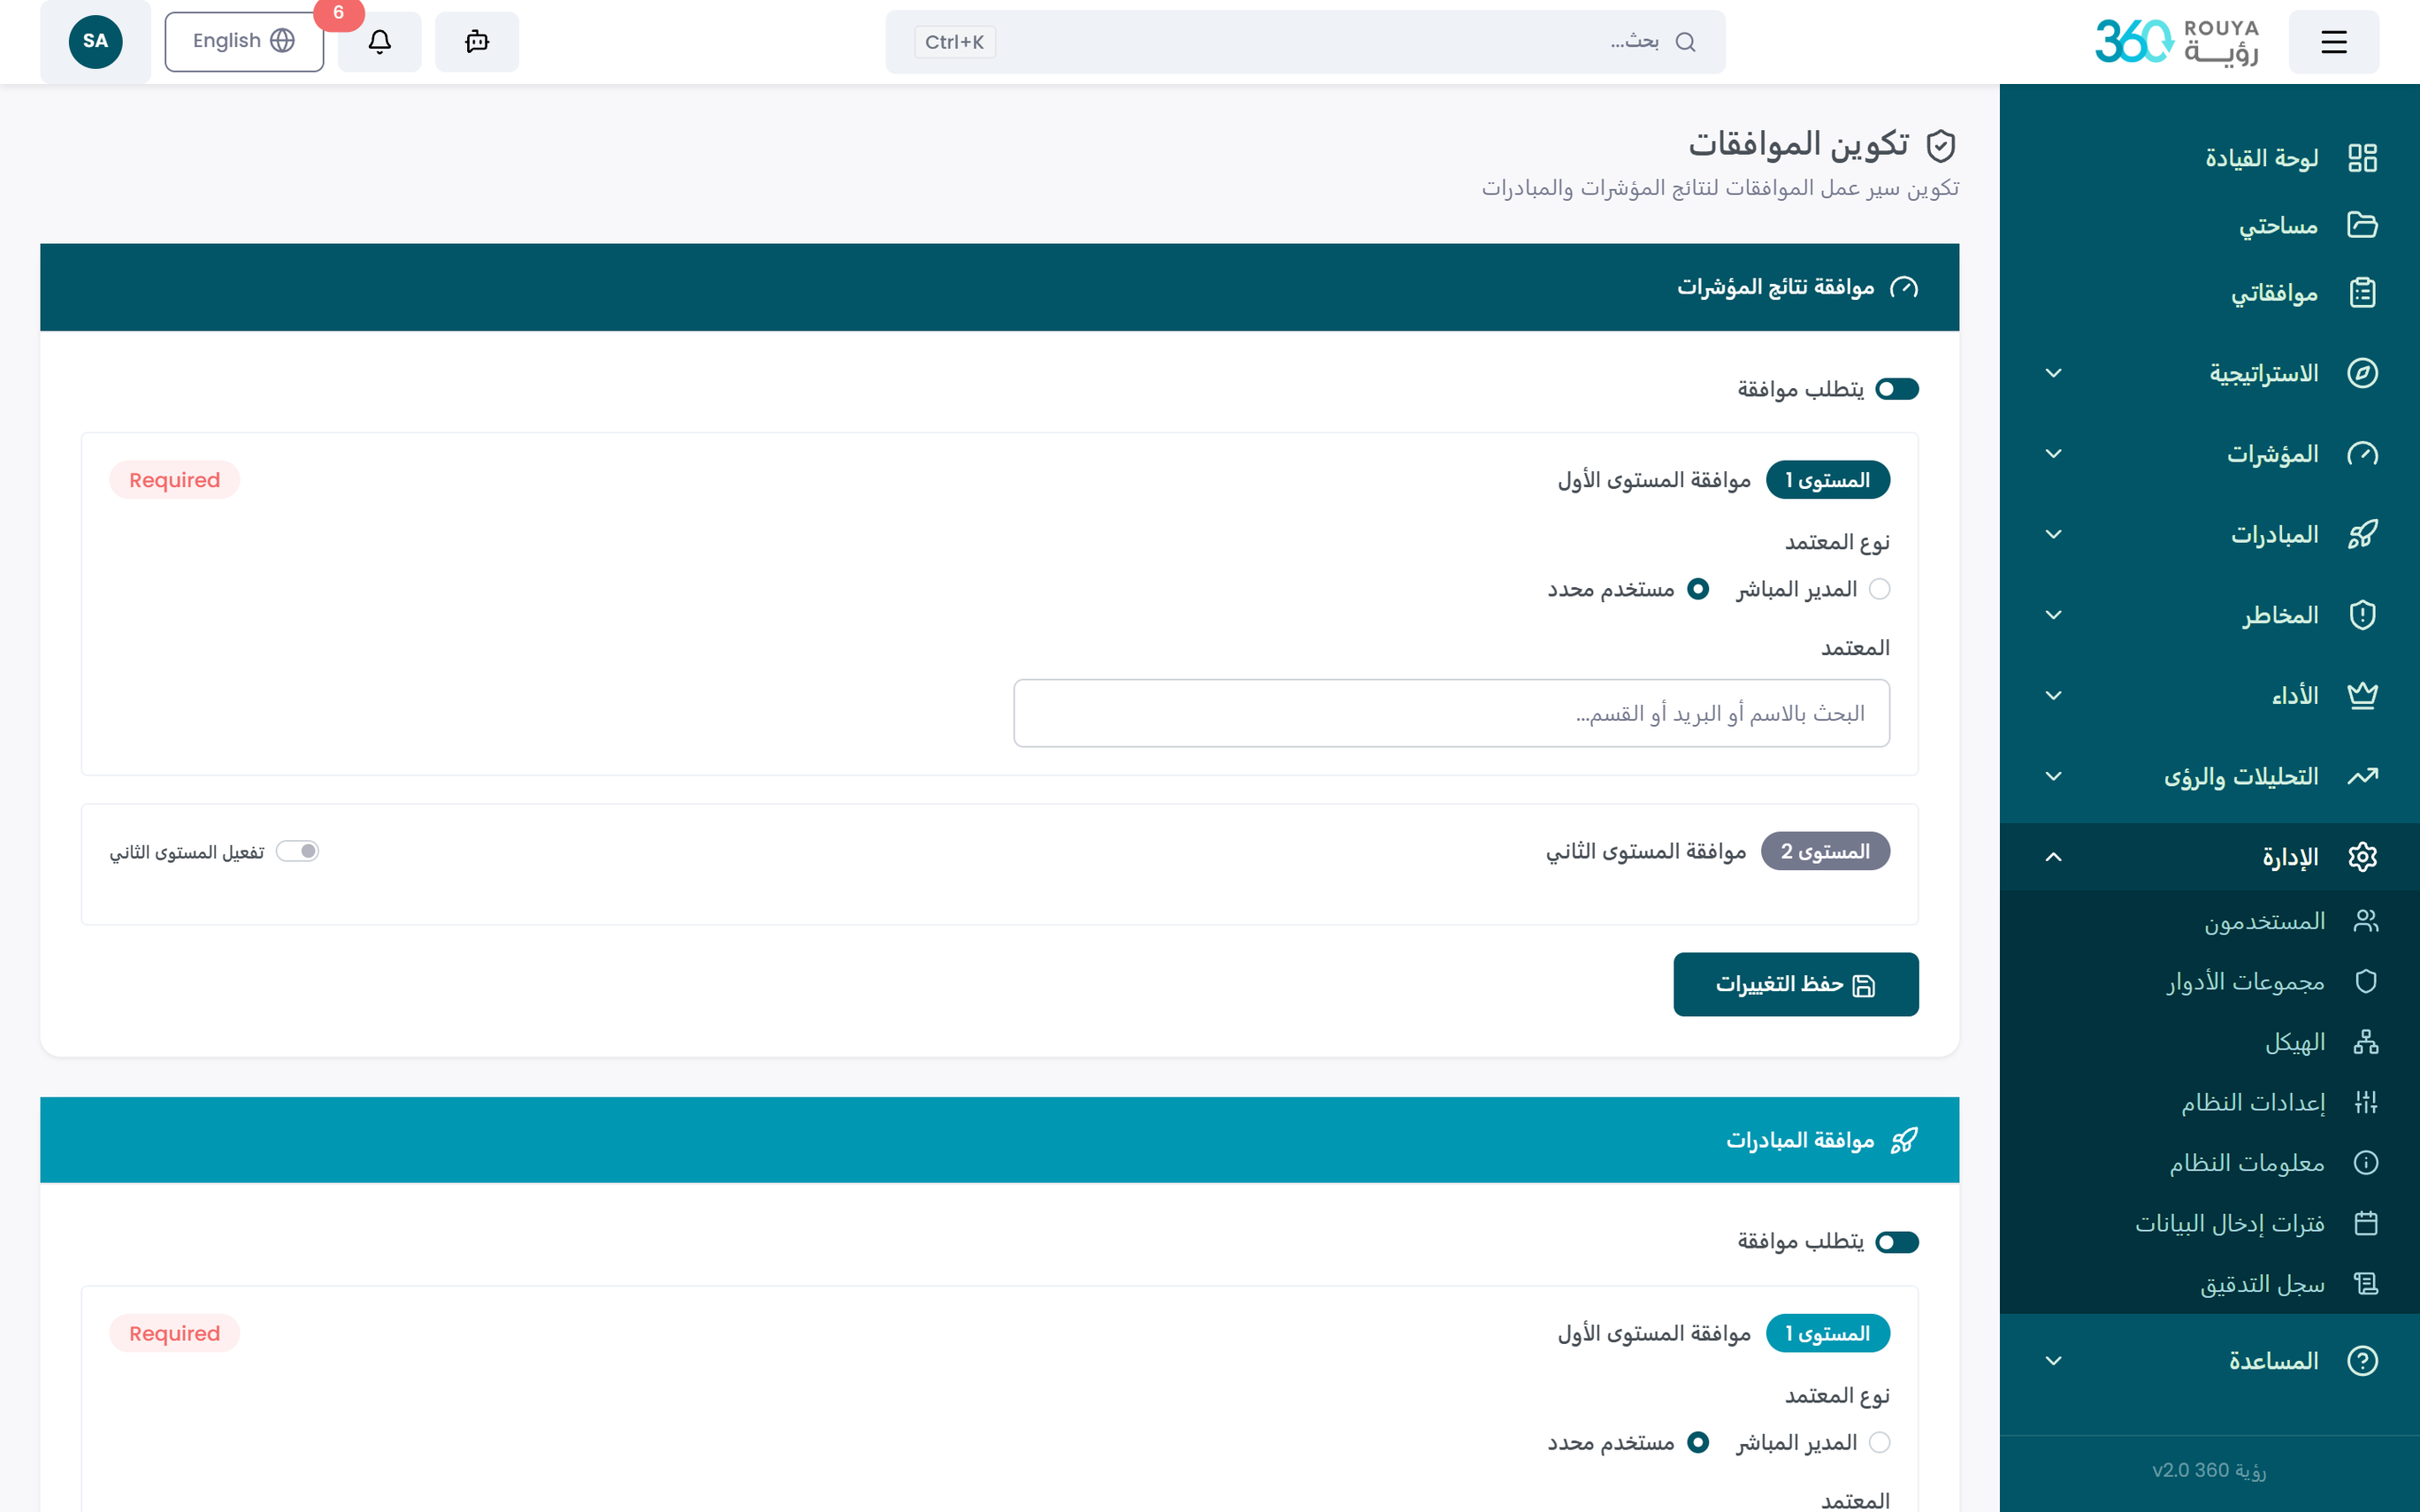
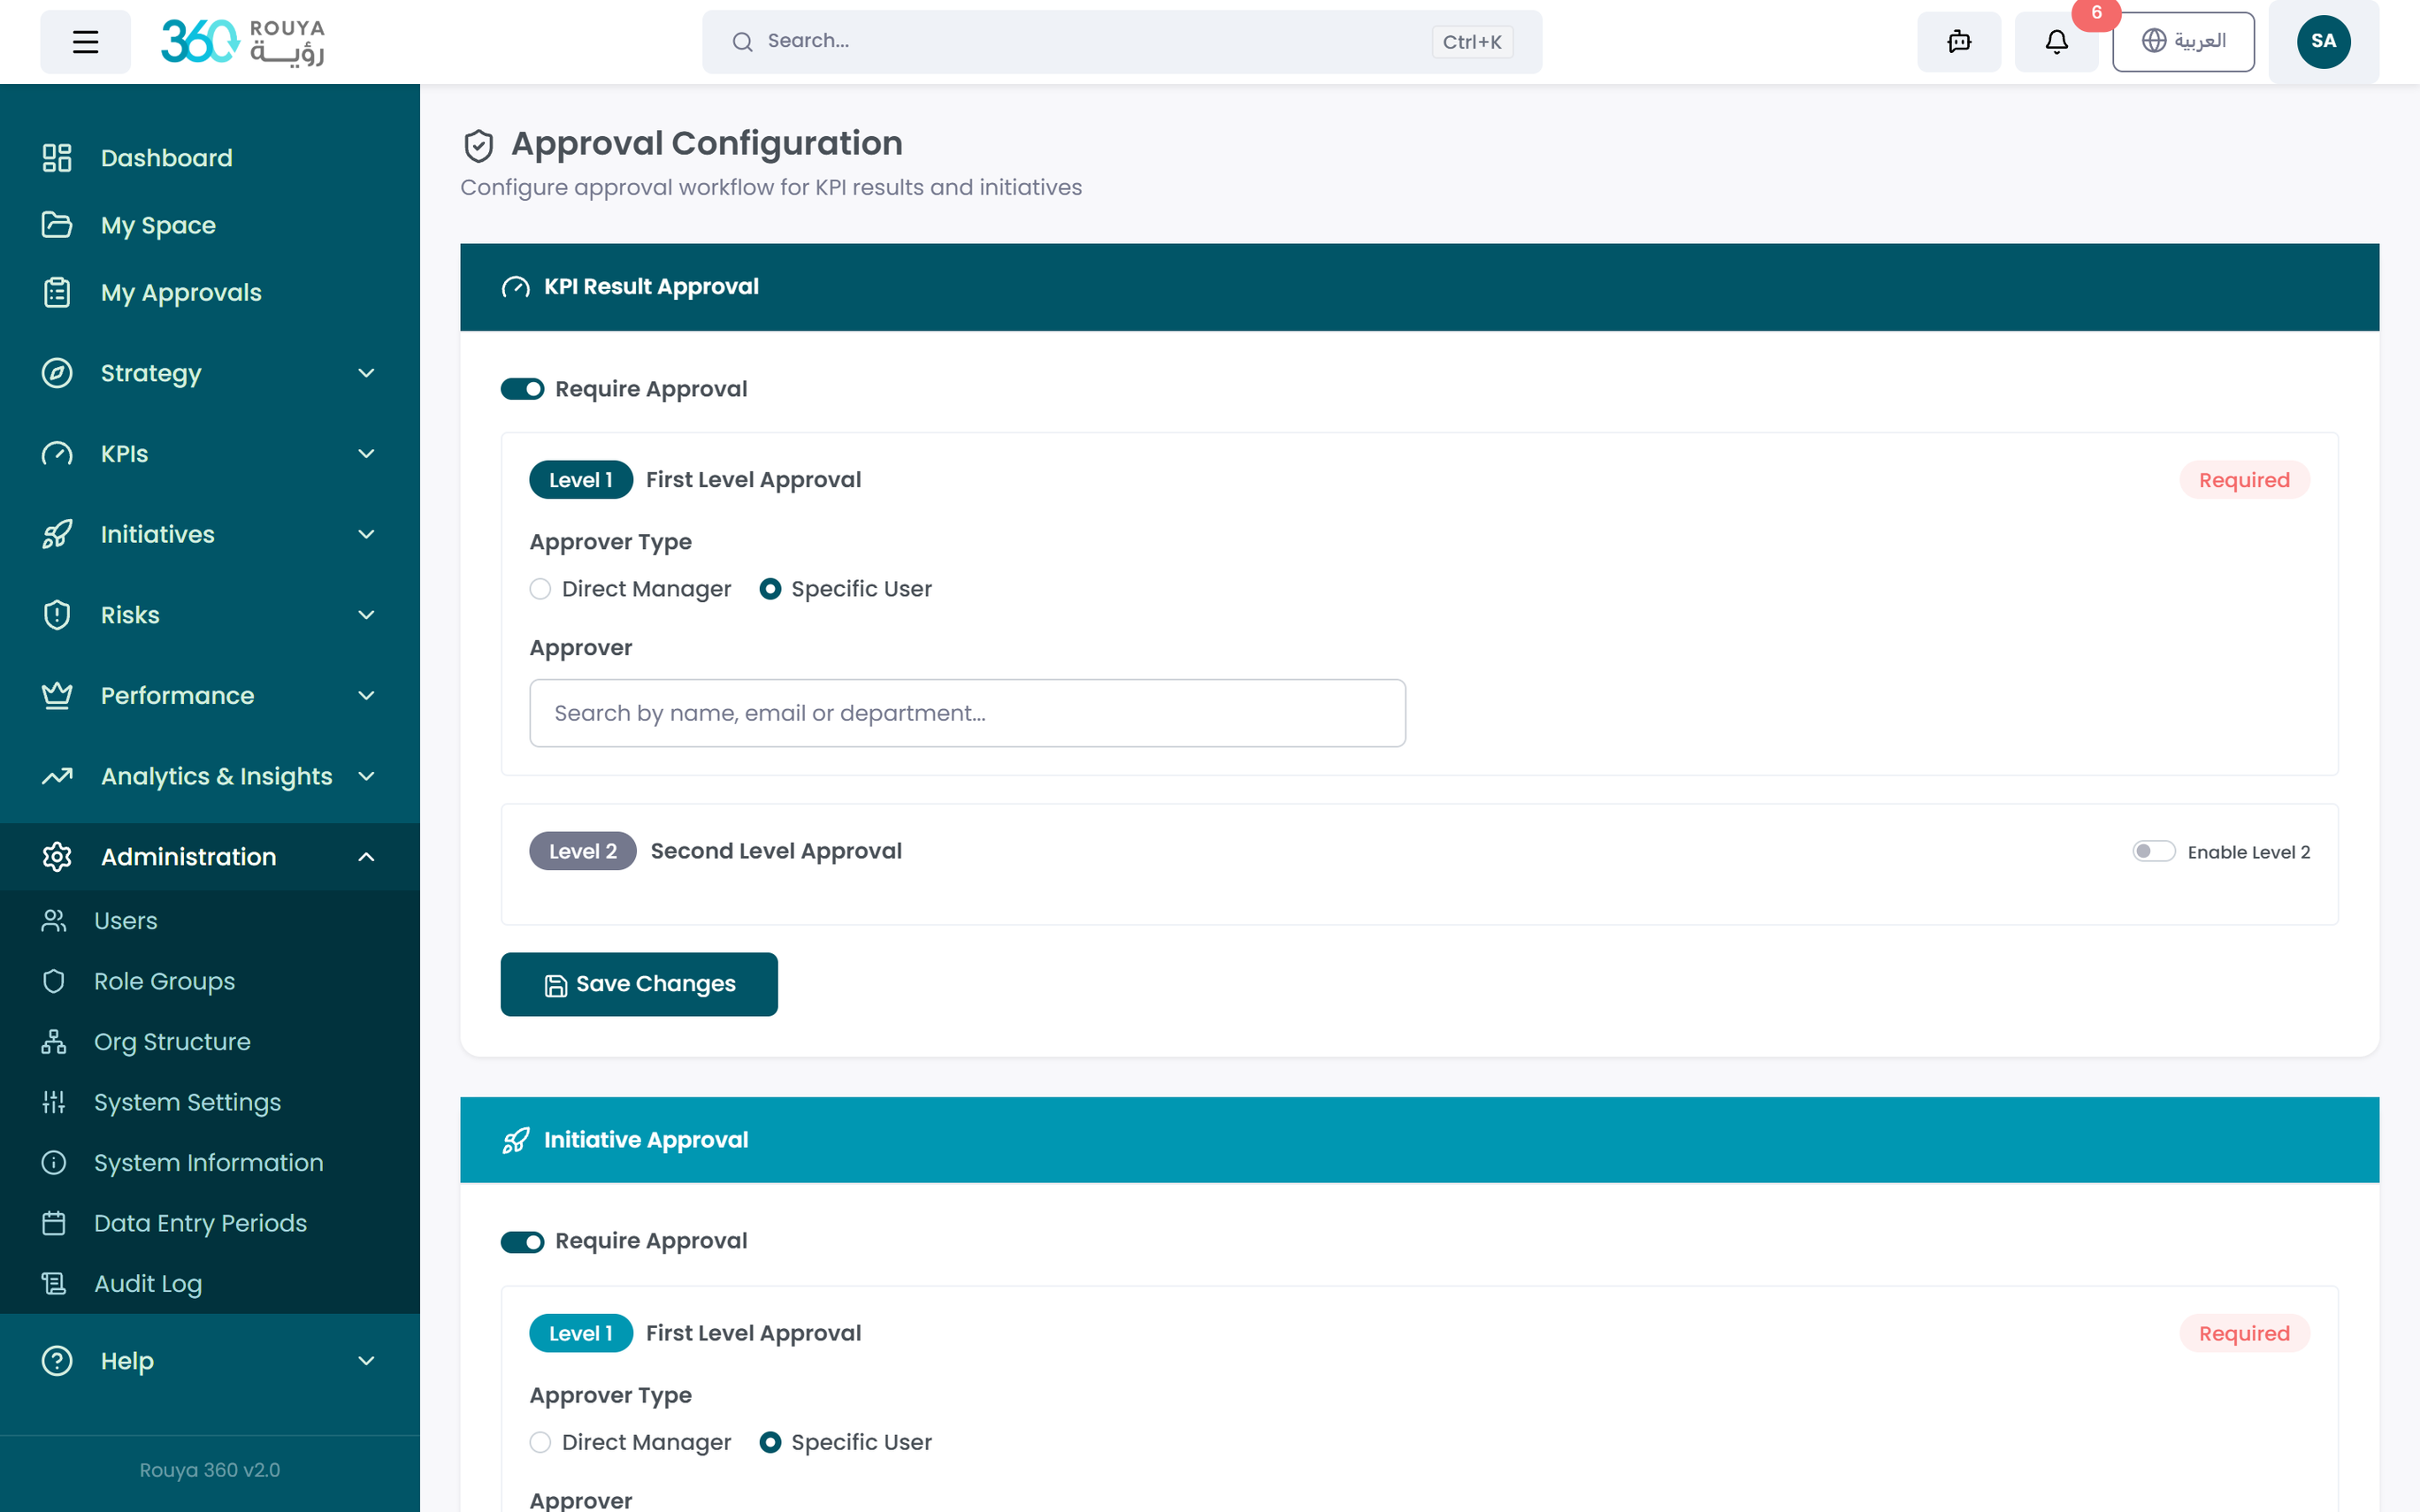
Approval Workflows
Route KPI results and initiative progress updates through configurable multi-level review, approval, and endorsement workflows. Reviewers can return submissions for correction with inline comments. Every action — submission, approval, revision, or rejection — is permanently recorded in a tamper-proof audit trail.
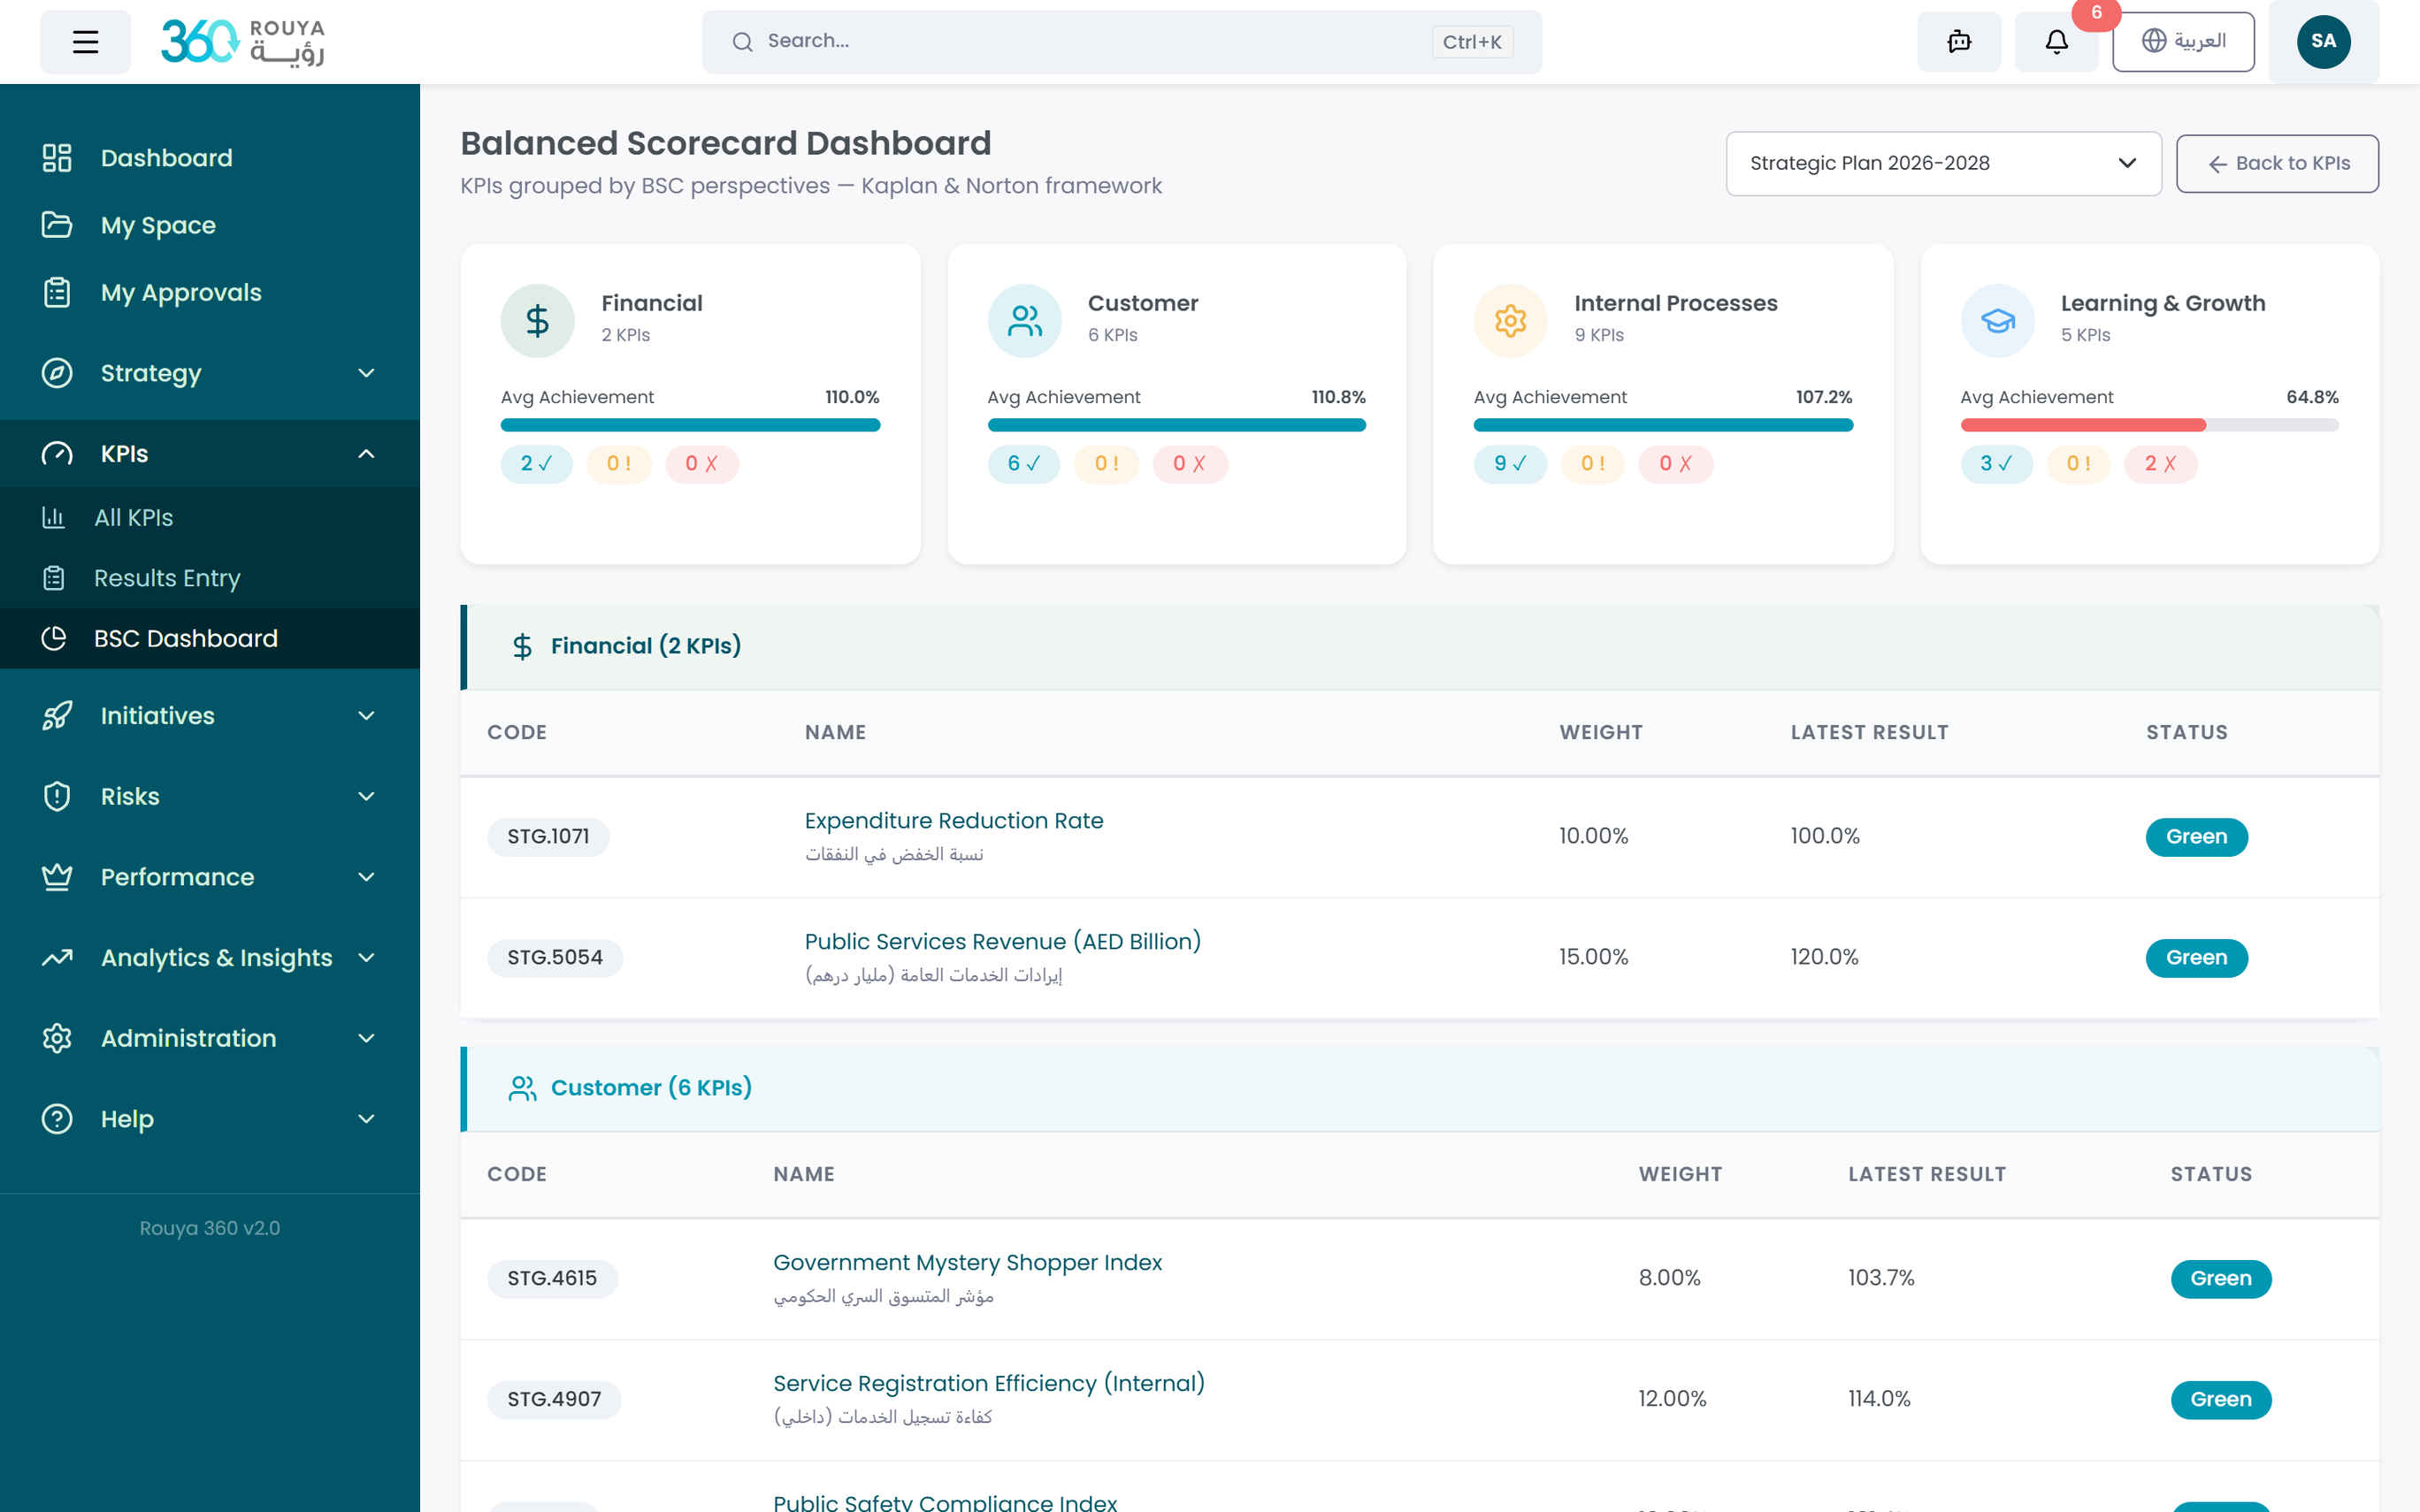
Performance Scoring Engine
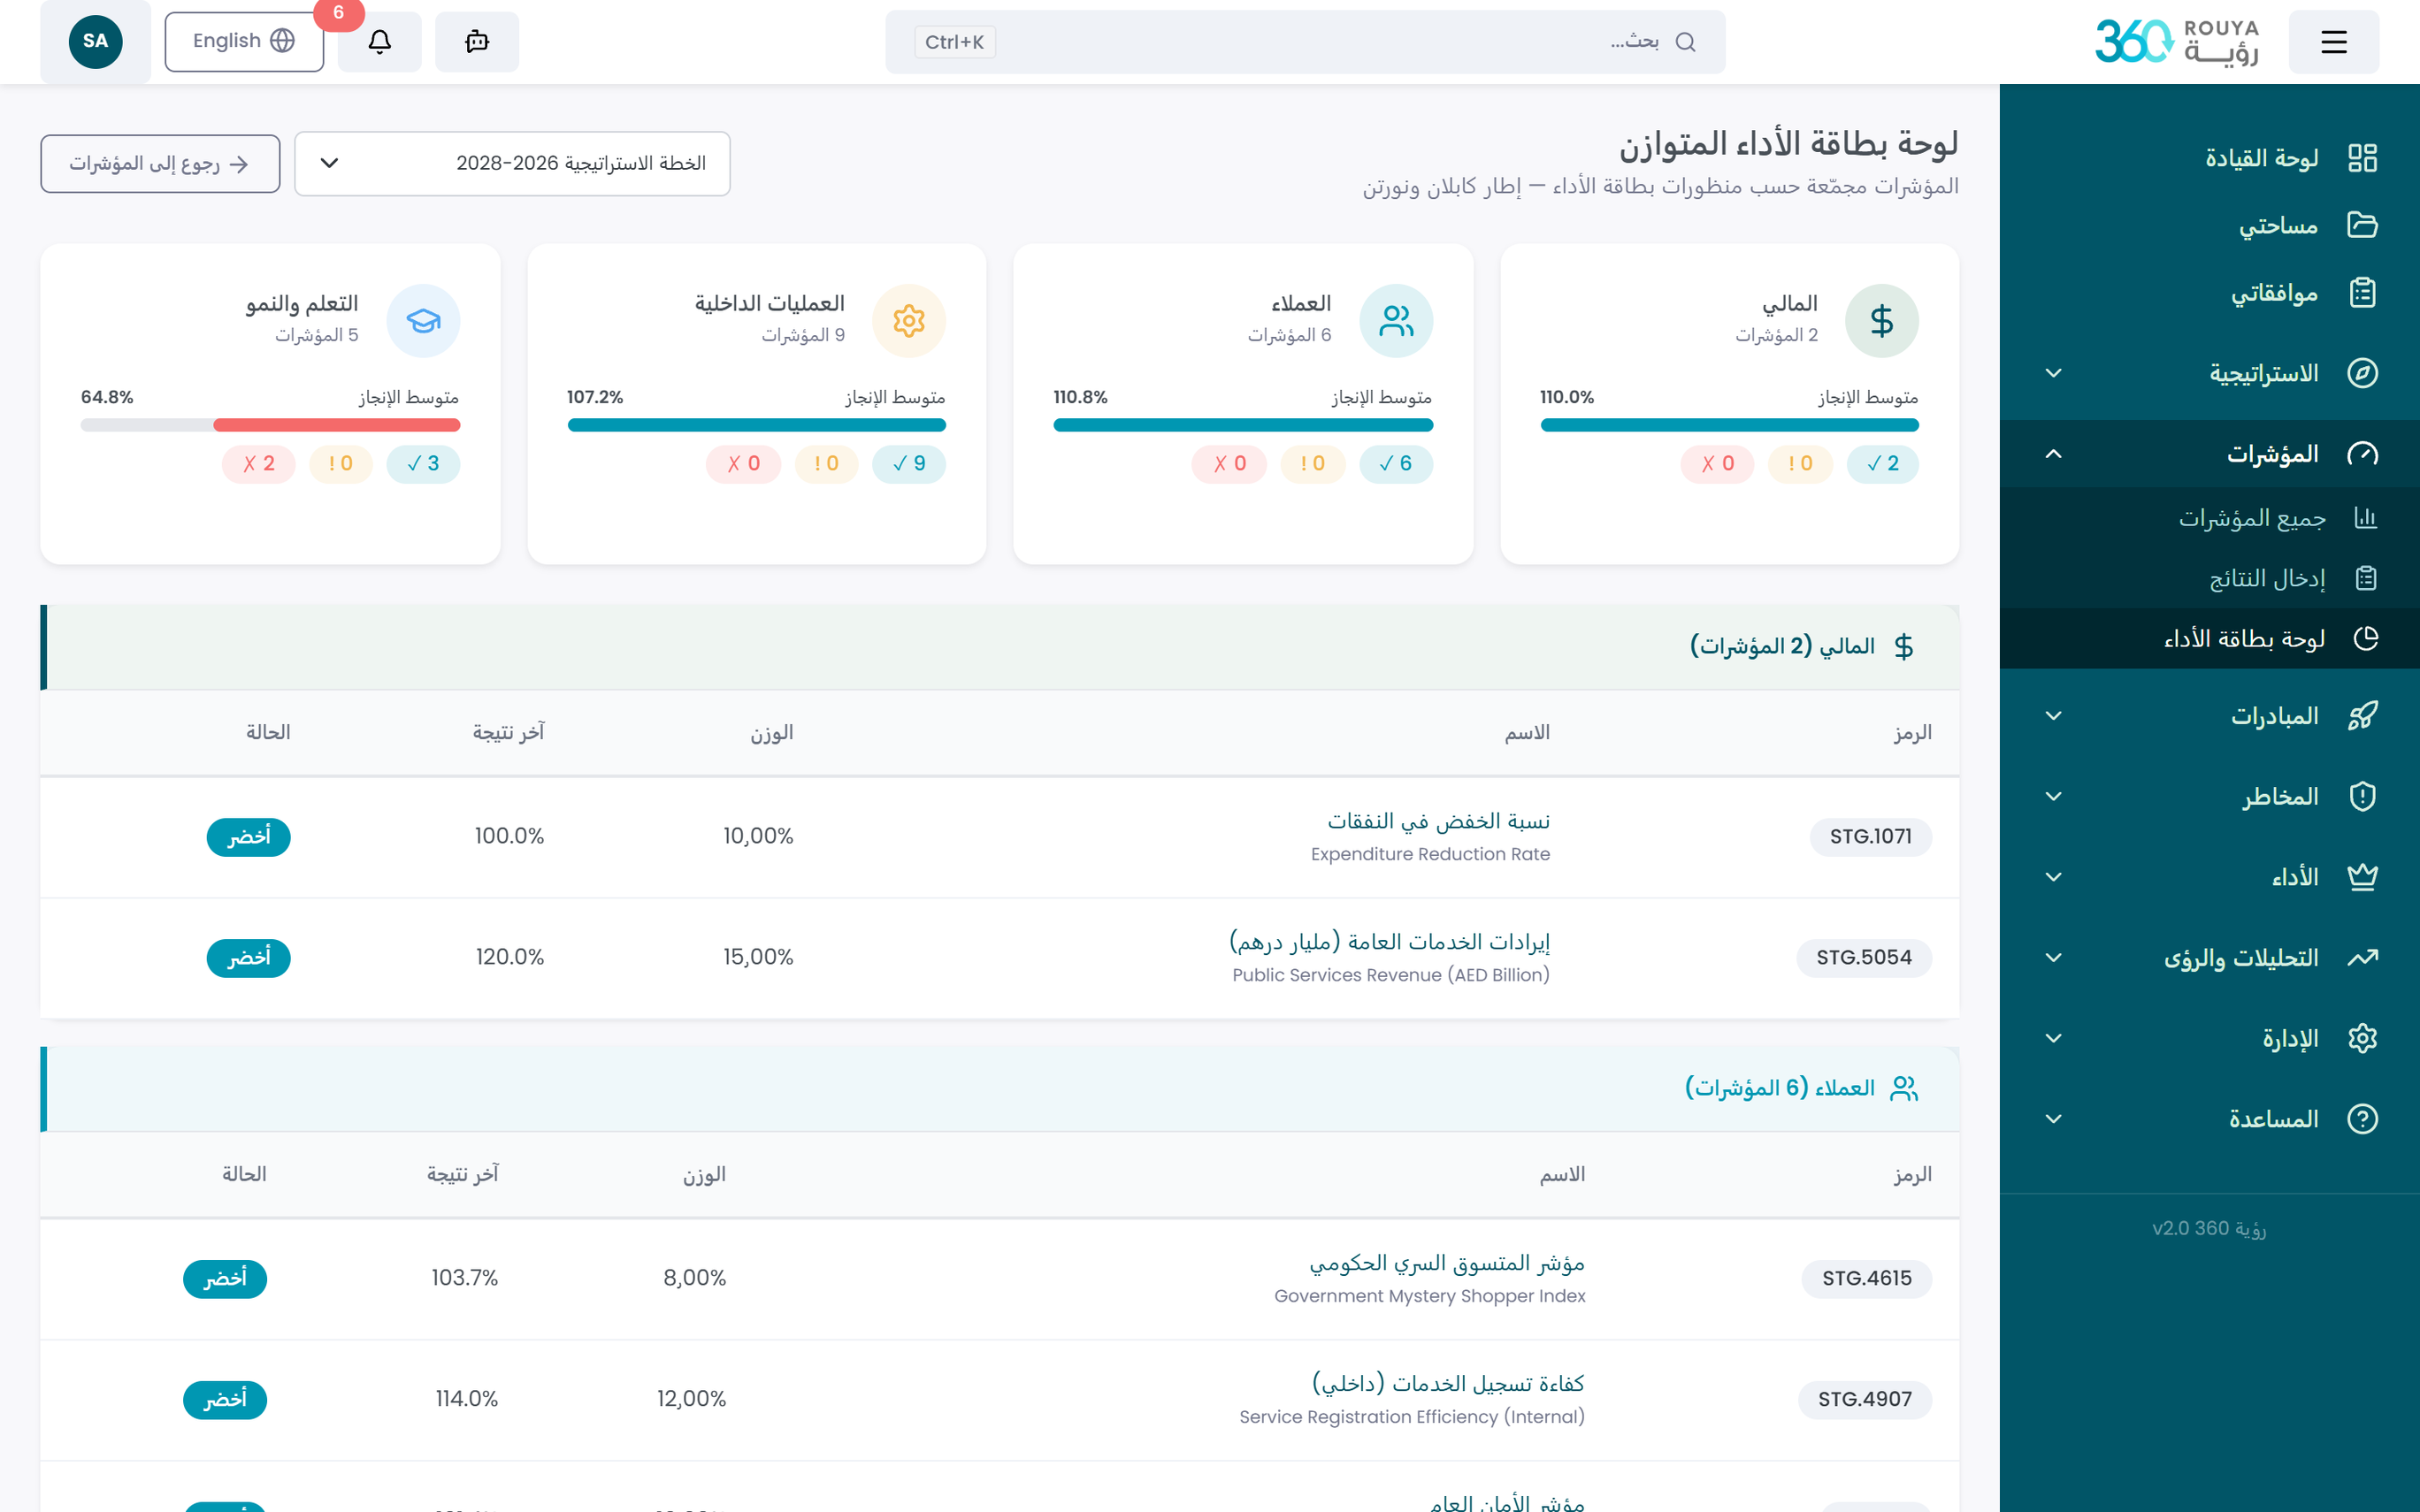
Compute strategy performance using six methodologies: KPI-based (targets achieved ÷ total × weights), initiative-based, blended 50/50, average KPI ratios, average initiative ratios, or a fully custom formula. Scores cascade automatically from individual KPIs → strategic goals → pillars → organizational units → overall strategy plan. All weighted scoring includes automatic validation that weights sum to 100% at every tier.
Risk Management
Maintain a live risk registry linked directly to KPIs and initiatives. Classify risks across nine categories — strategic, operational, financial, compliance, reputational, legal, technology, environmental, and HR. Assess probability and impact, define treatment plans and preventive actions, and monitor risk status through periodic reports. A dedicated risk dashboard gives leadership an instant view of the full risk landscape at any time.
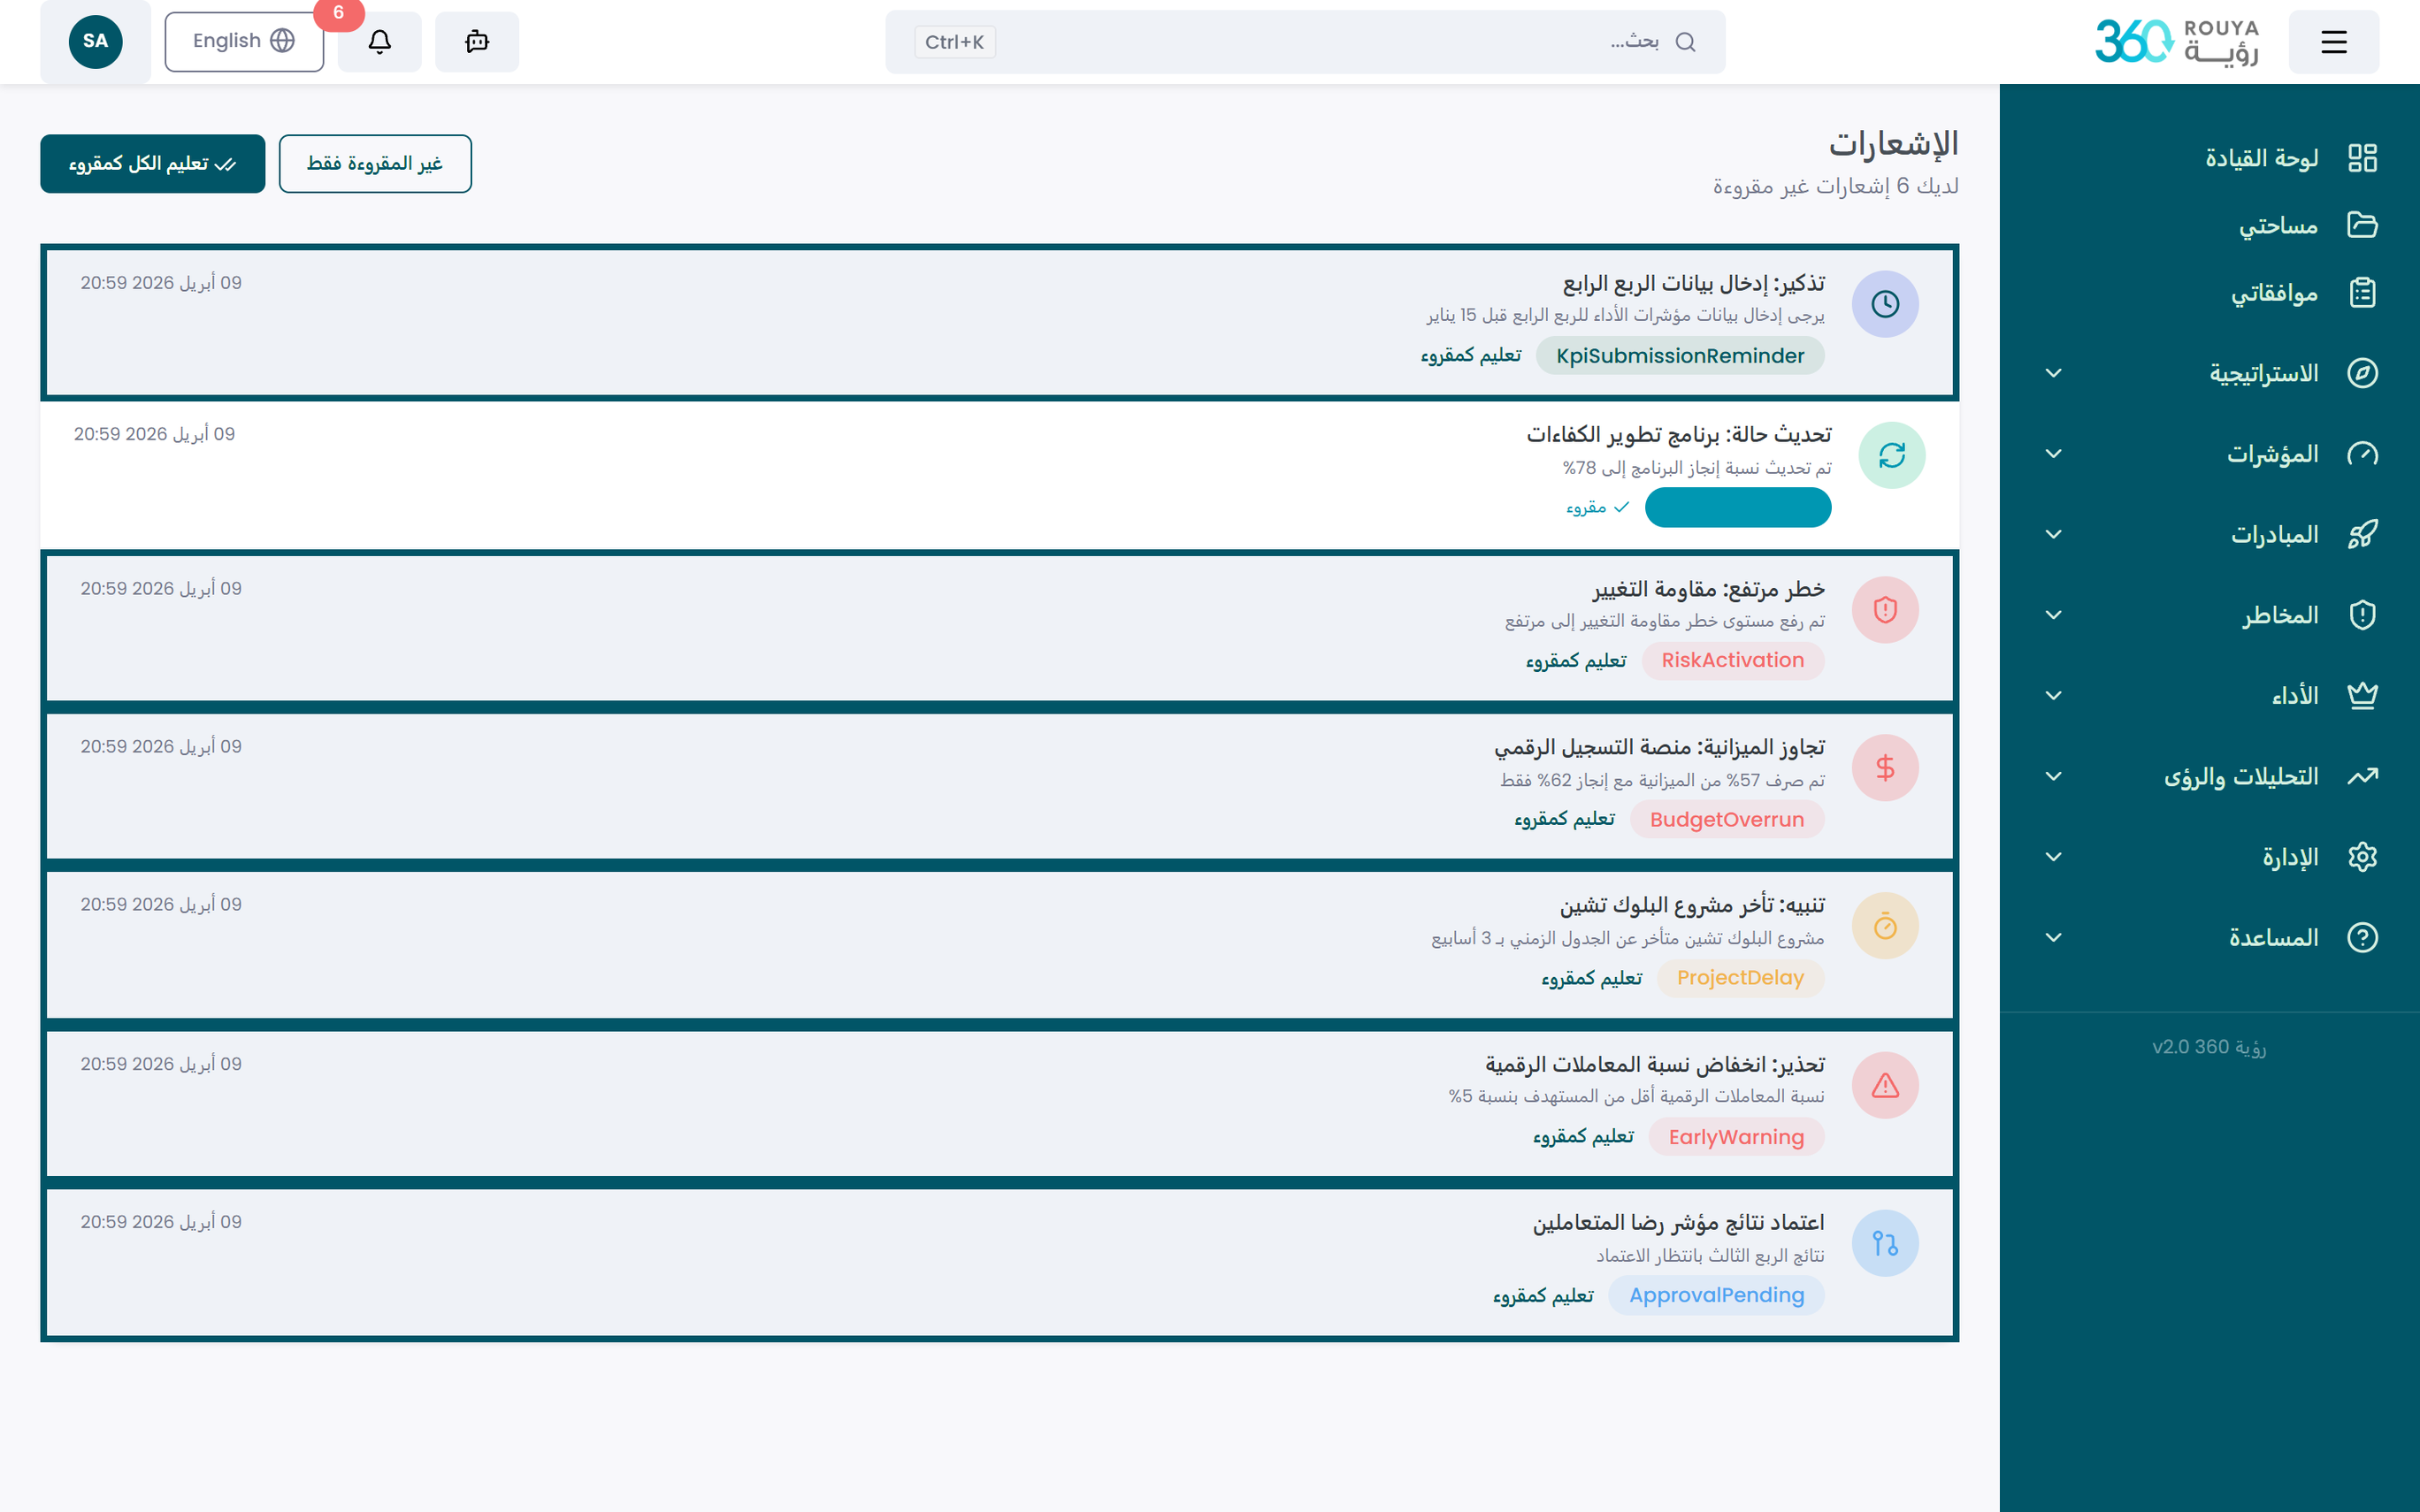
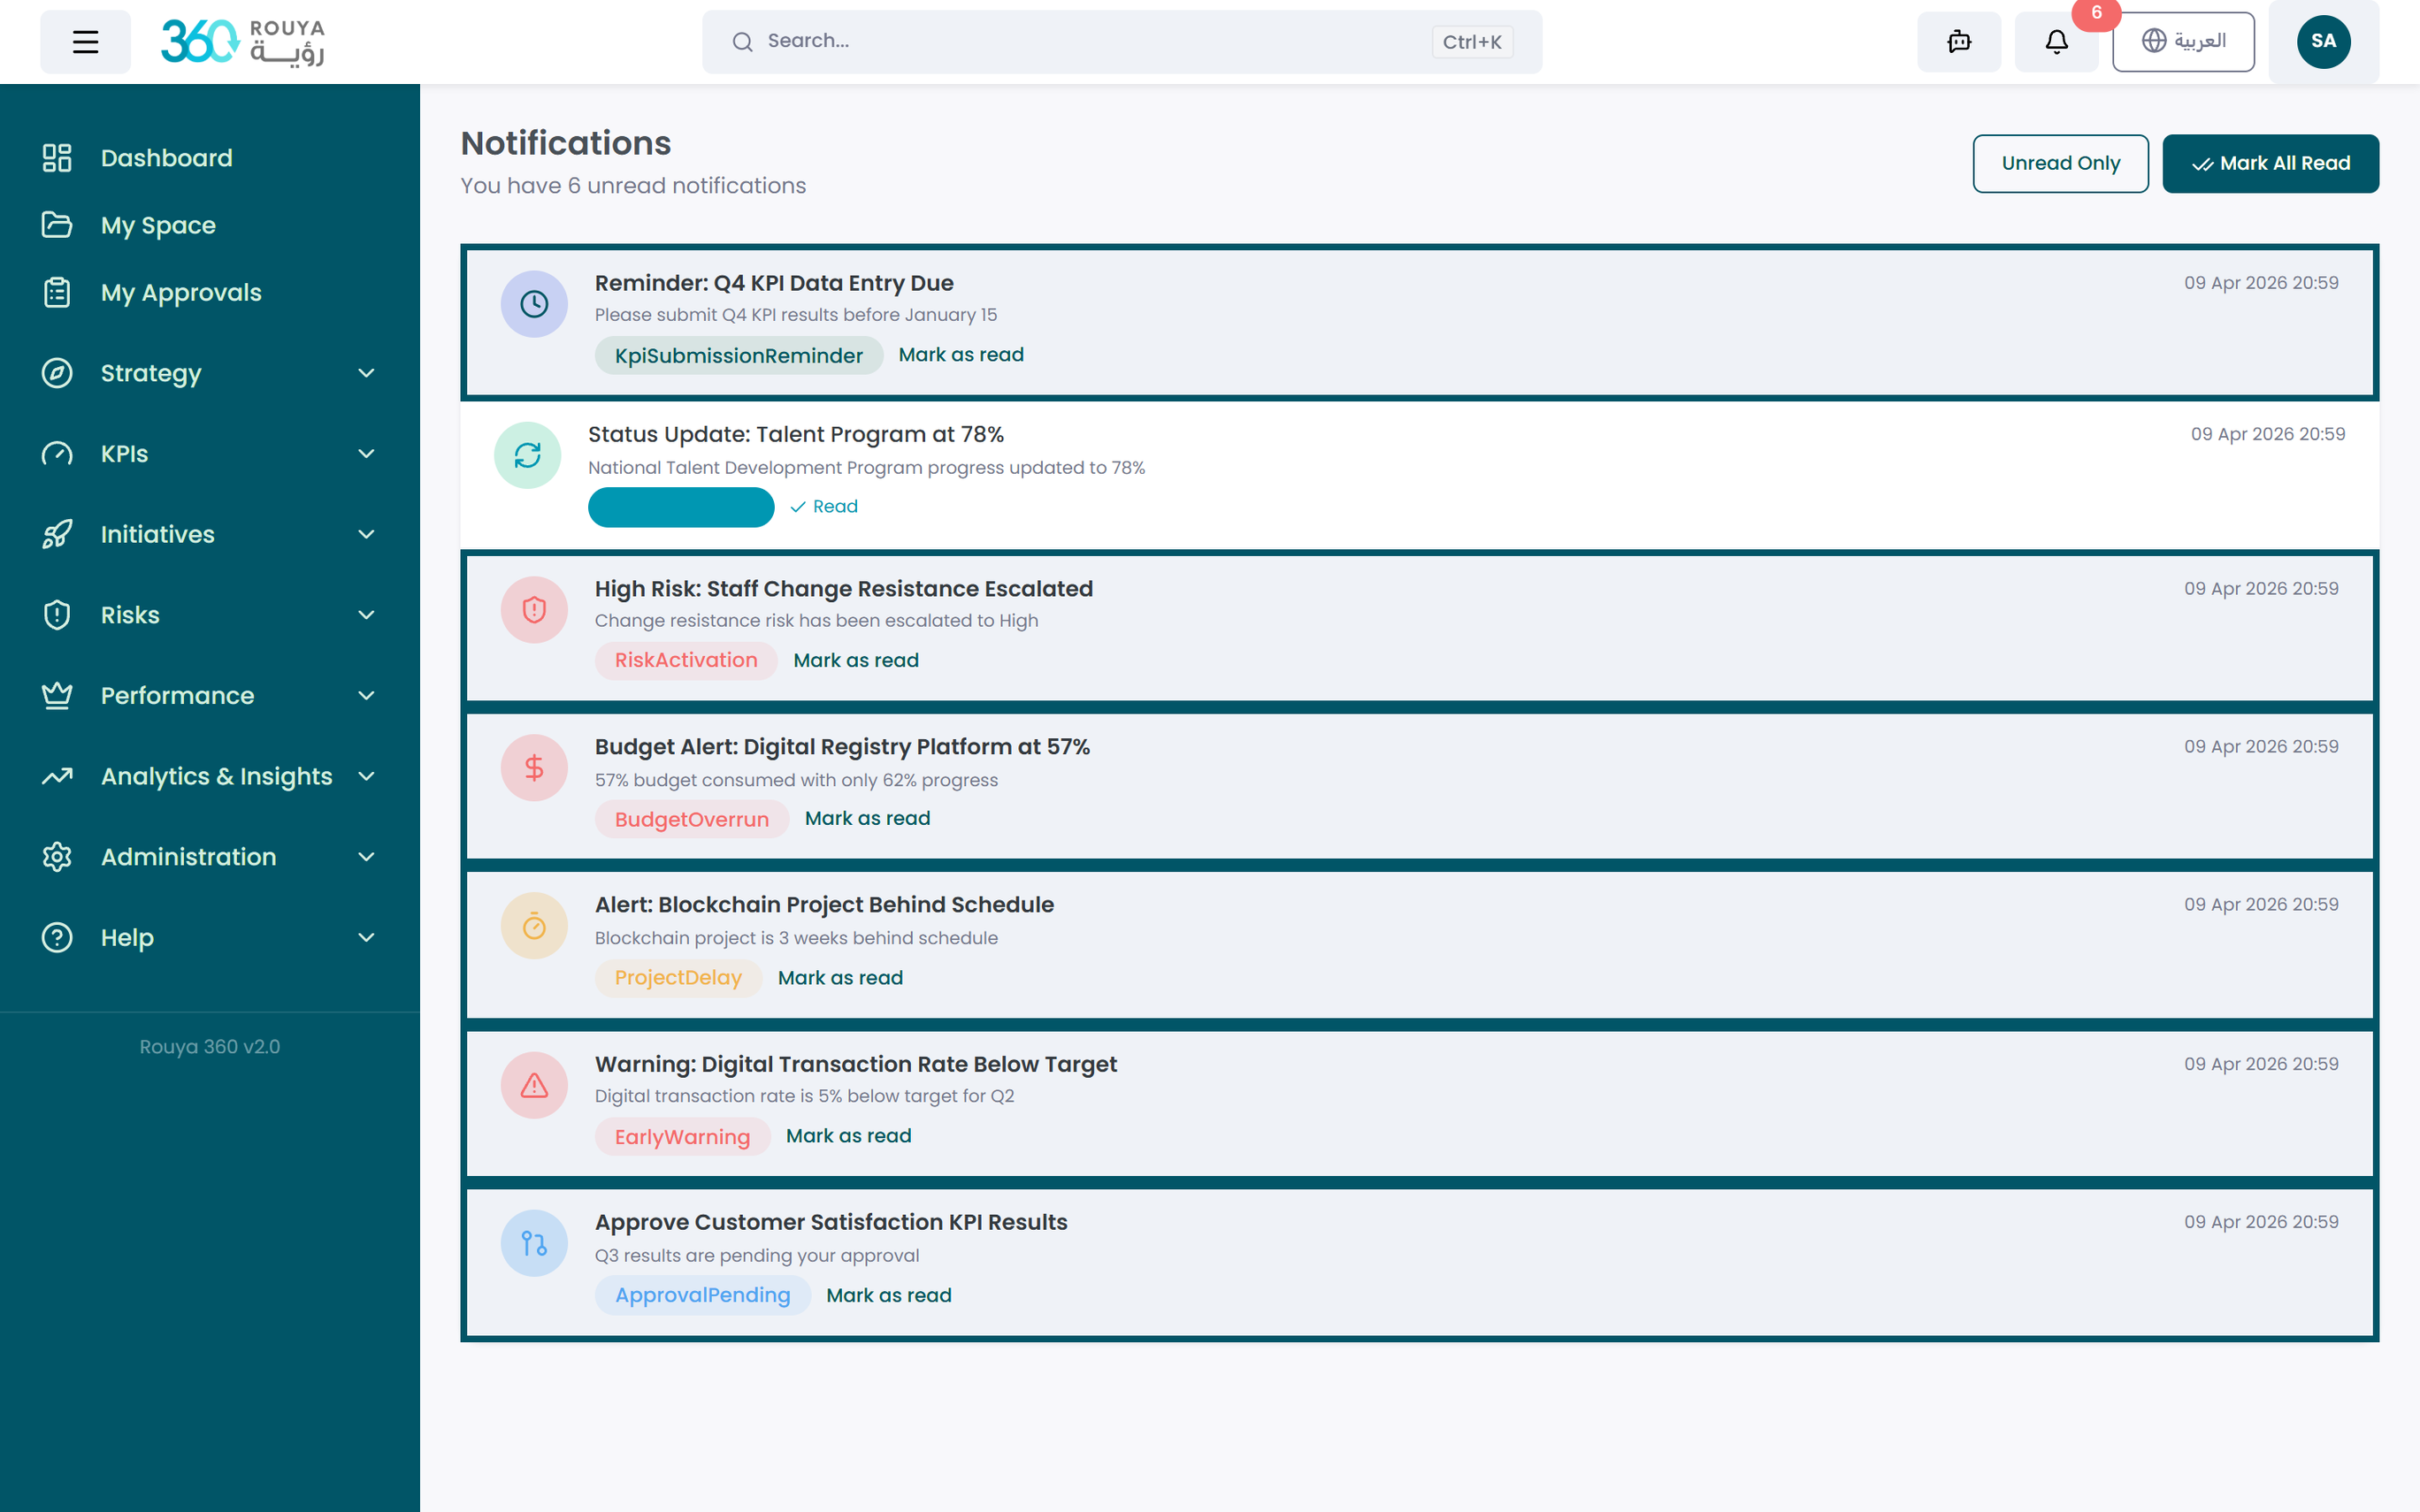
Smart Notifications
Proactive early-warning alerts before measurement deadlines. Automated notifications for delayed projects, budget exceedances, triggered risks, status changes, and pending approvals. Periodic performance digests delivered automatically to responsible officers. Each user customizes their own notification preferences across email and in-system channels.
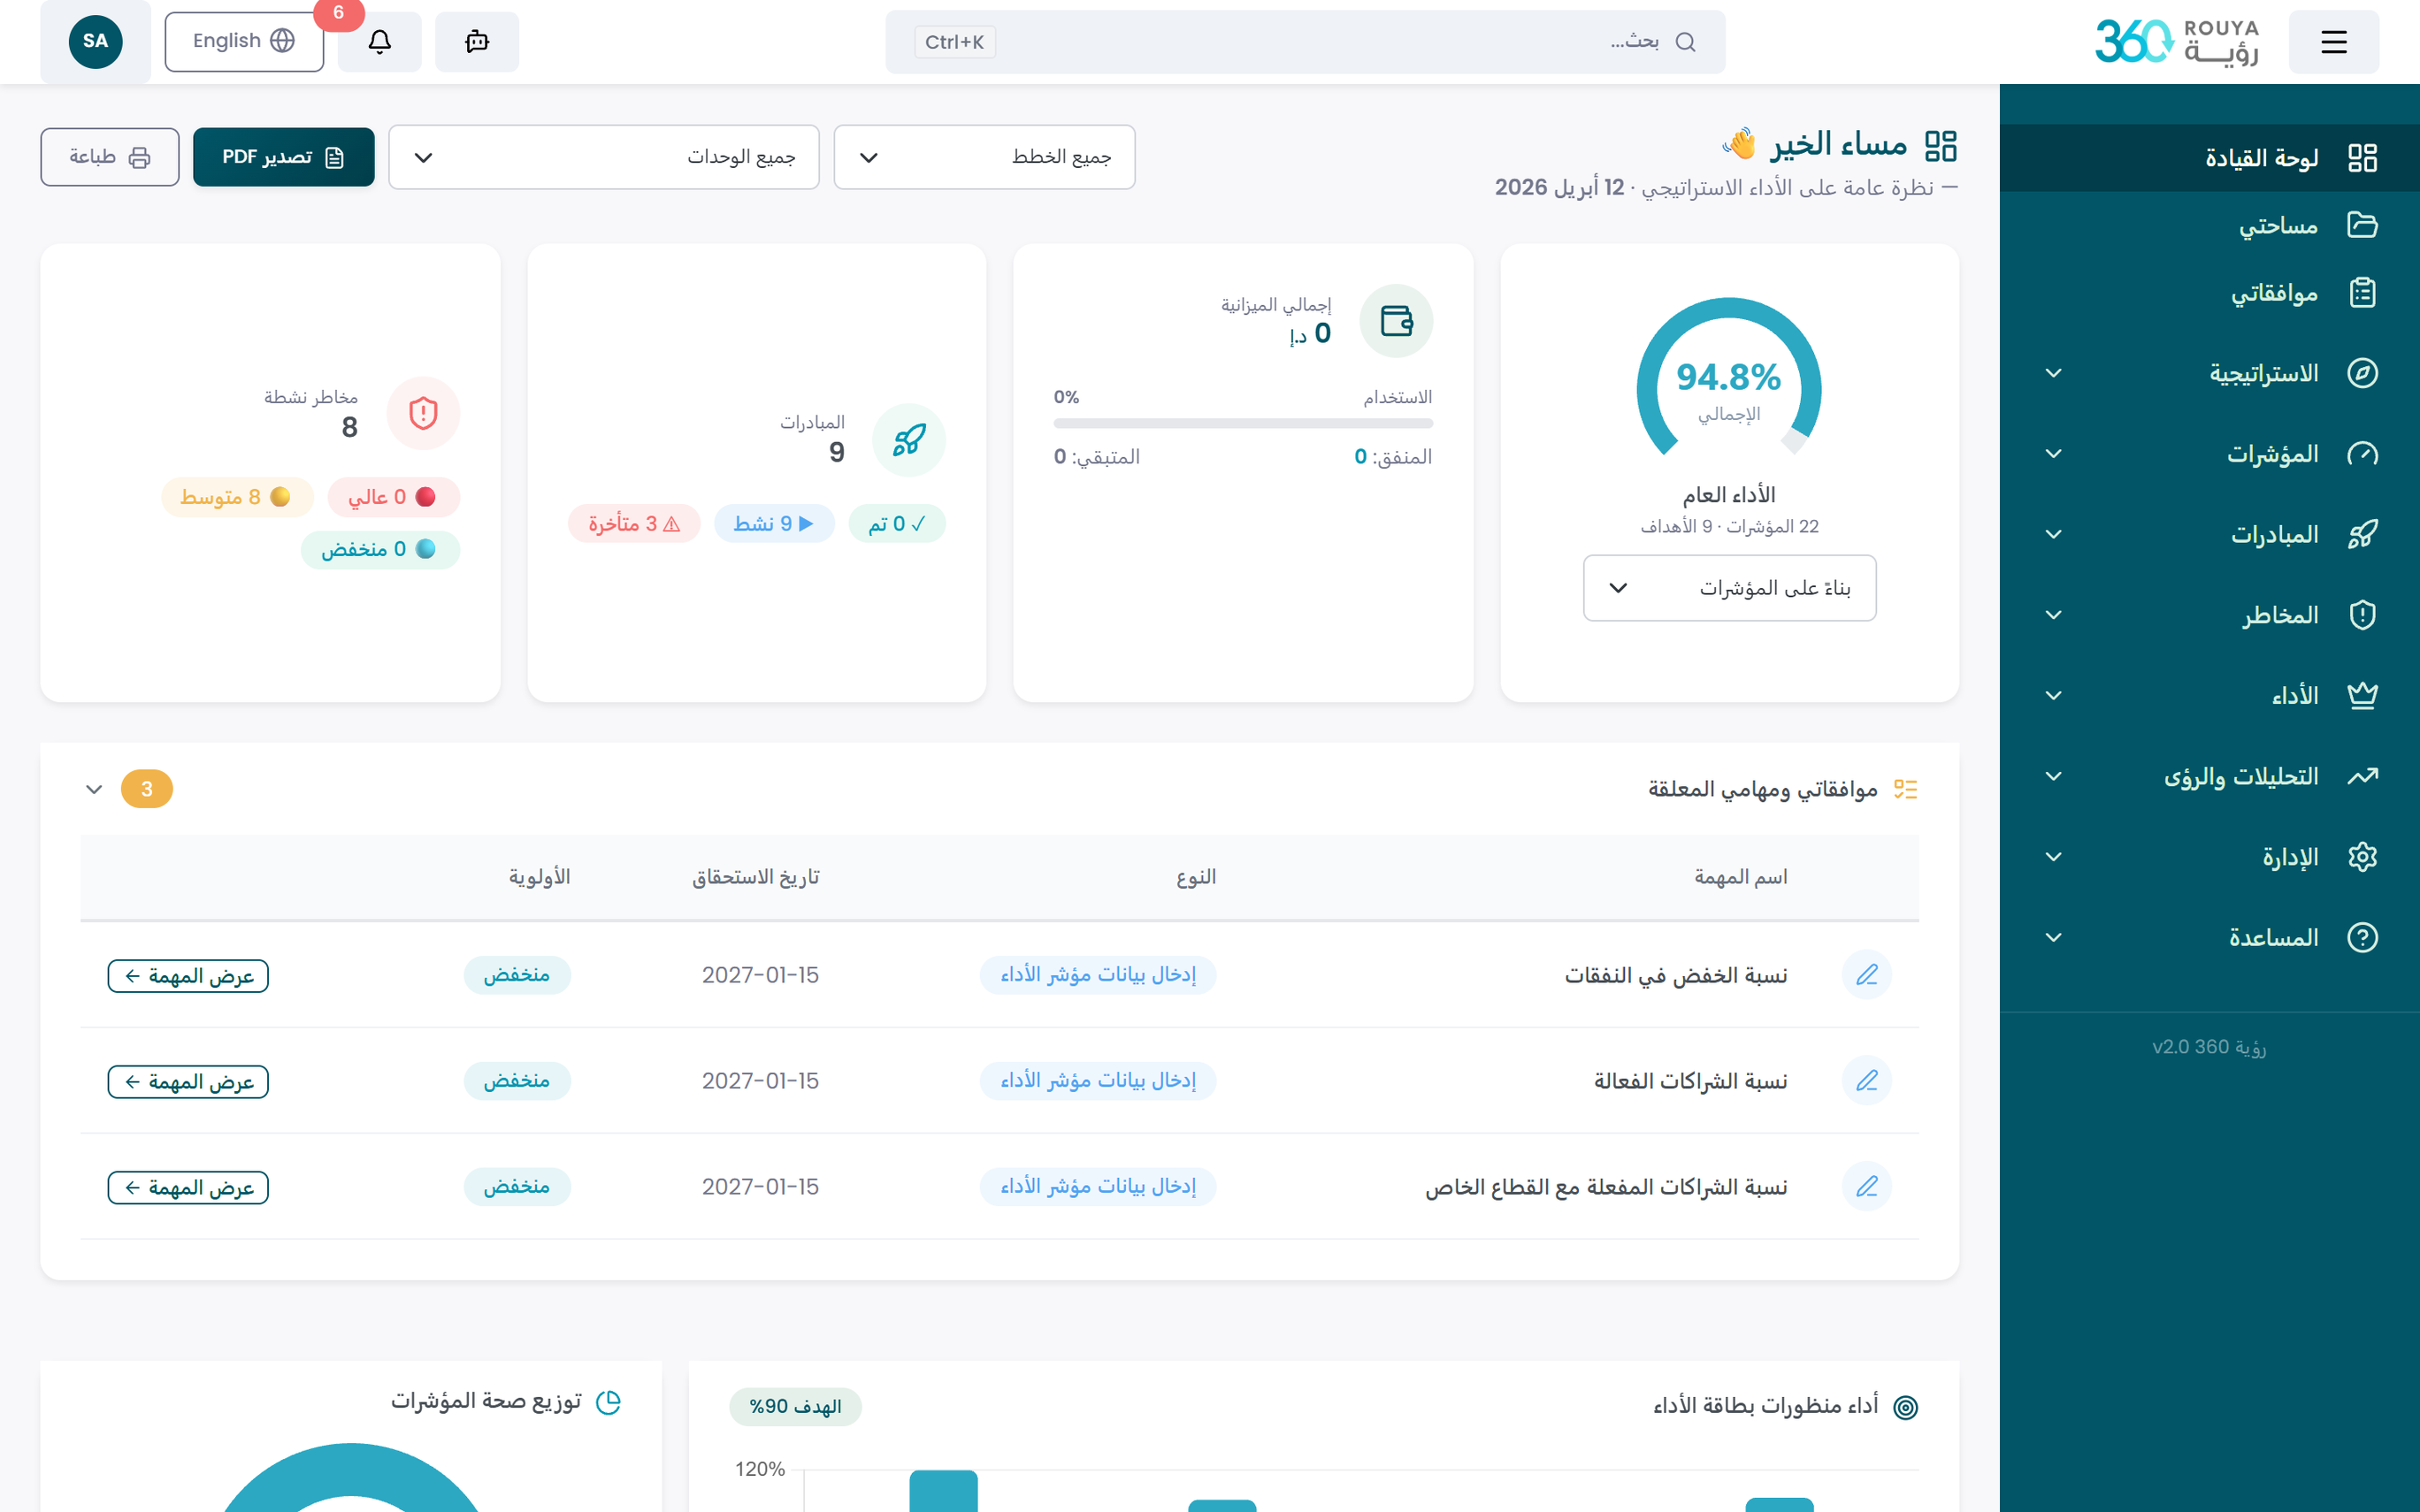
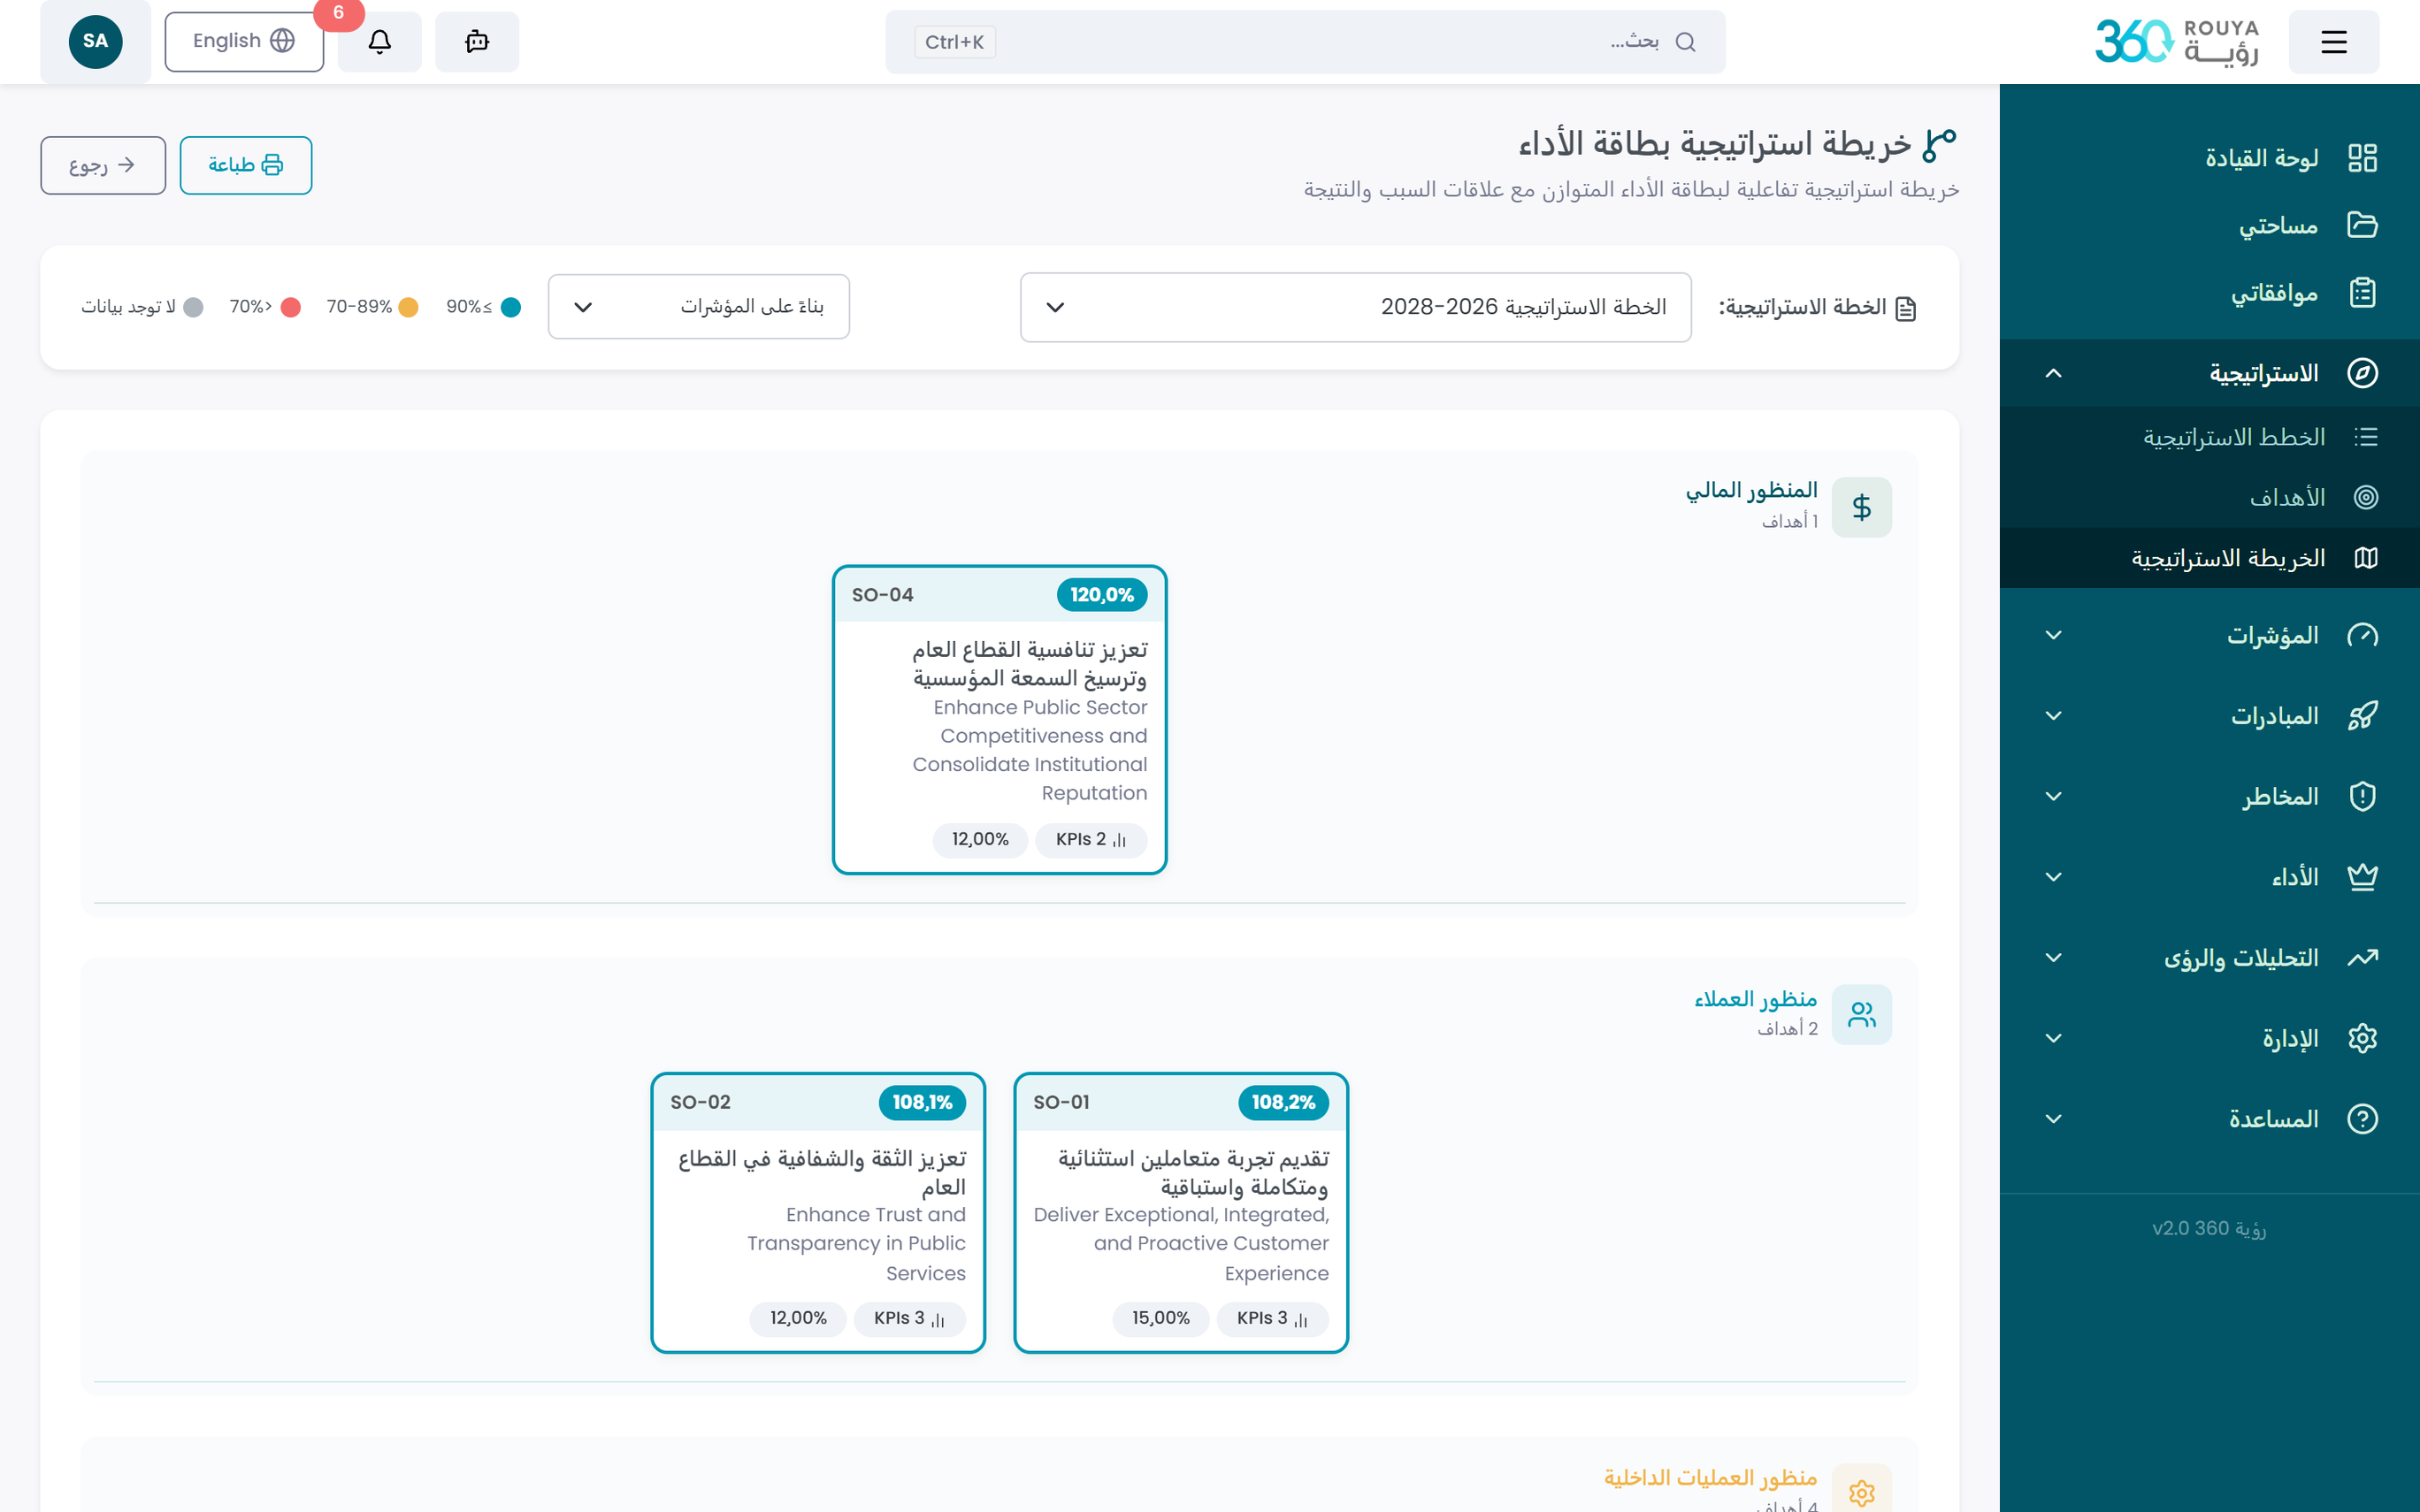
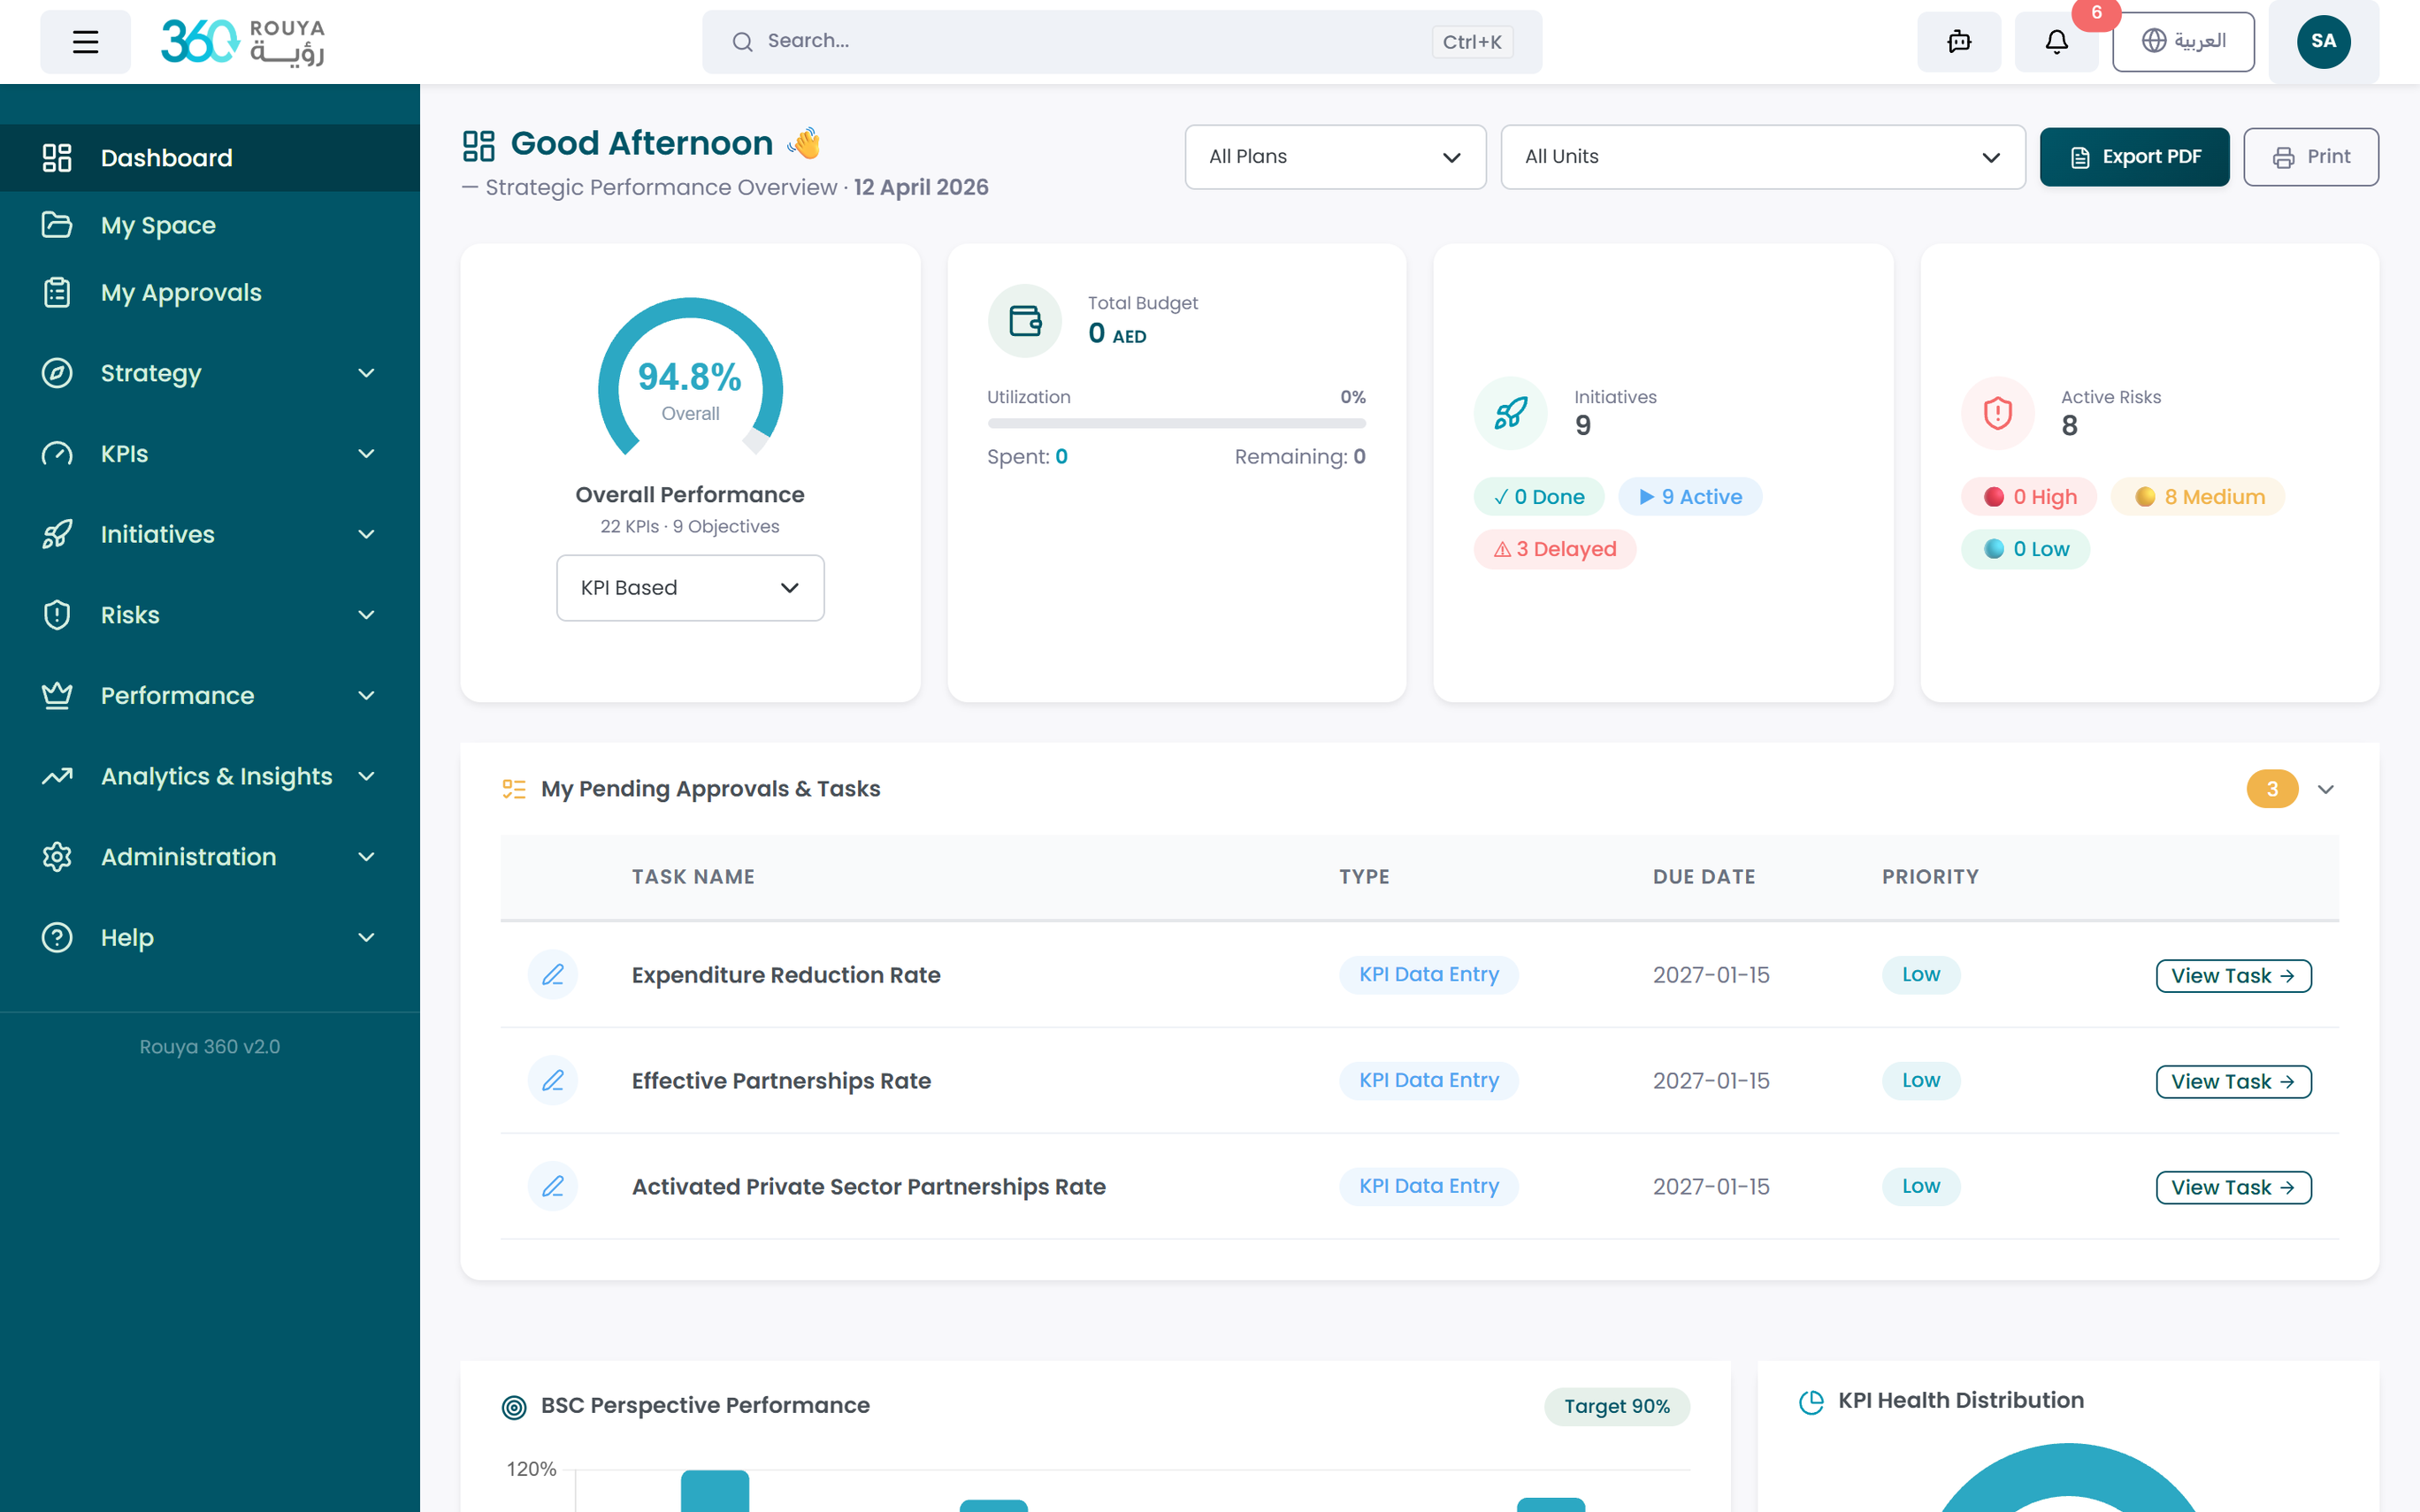
Dashboards & Reporting
Interactive executive dashboards with color-coded strategic goal maps — drill from any goal down to its KPIs, initiatives, and responsible units in one click. Role-specific dashboards for leadership, department heads, and analysts. Full report suite including comprehensive performance, critical KPIs, budget tracking, risk reports, and historical trends — exportable to PDF, Excel, and CSV, with automated scheduling and sharing.
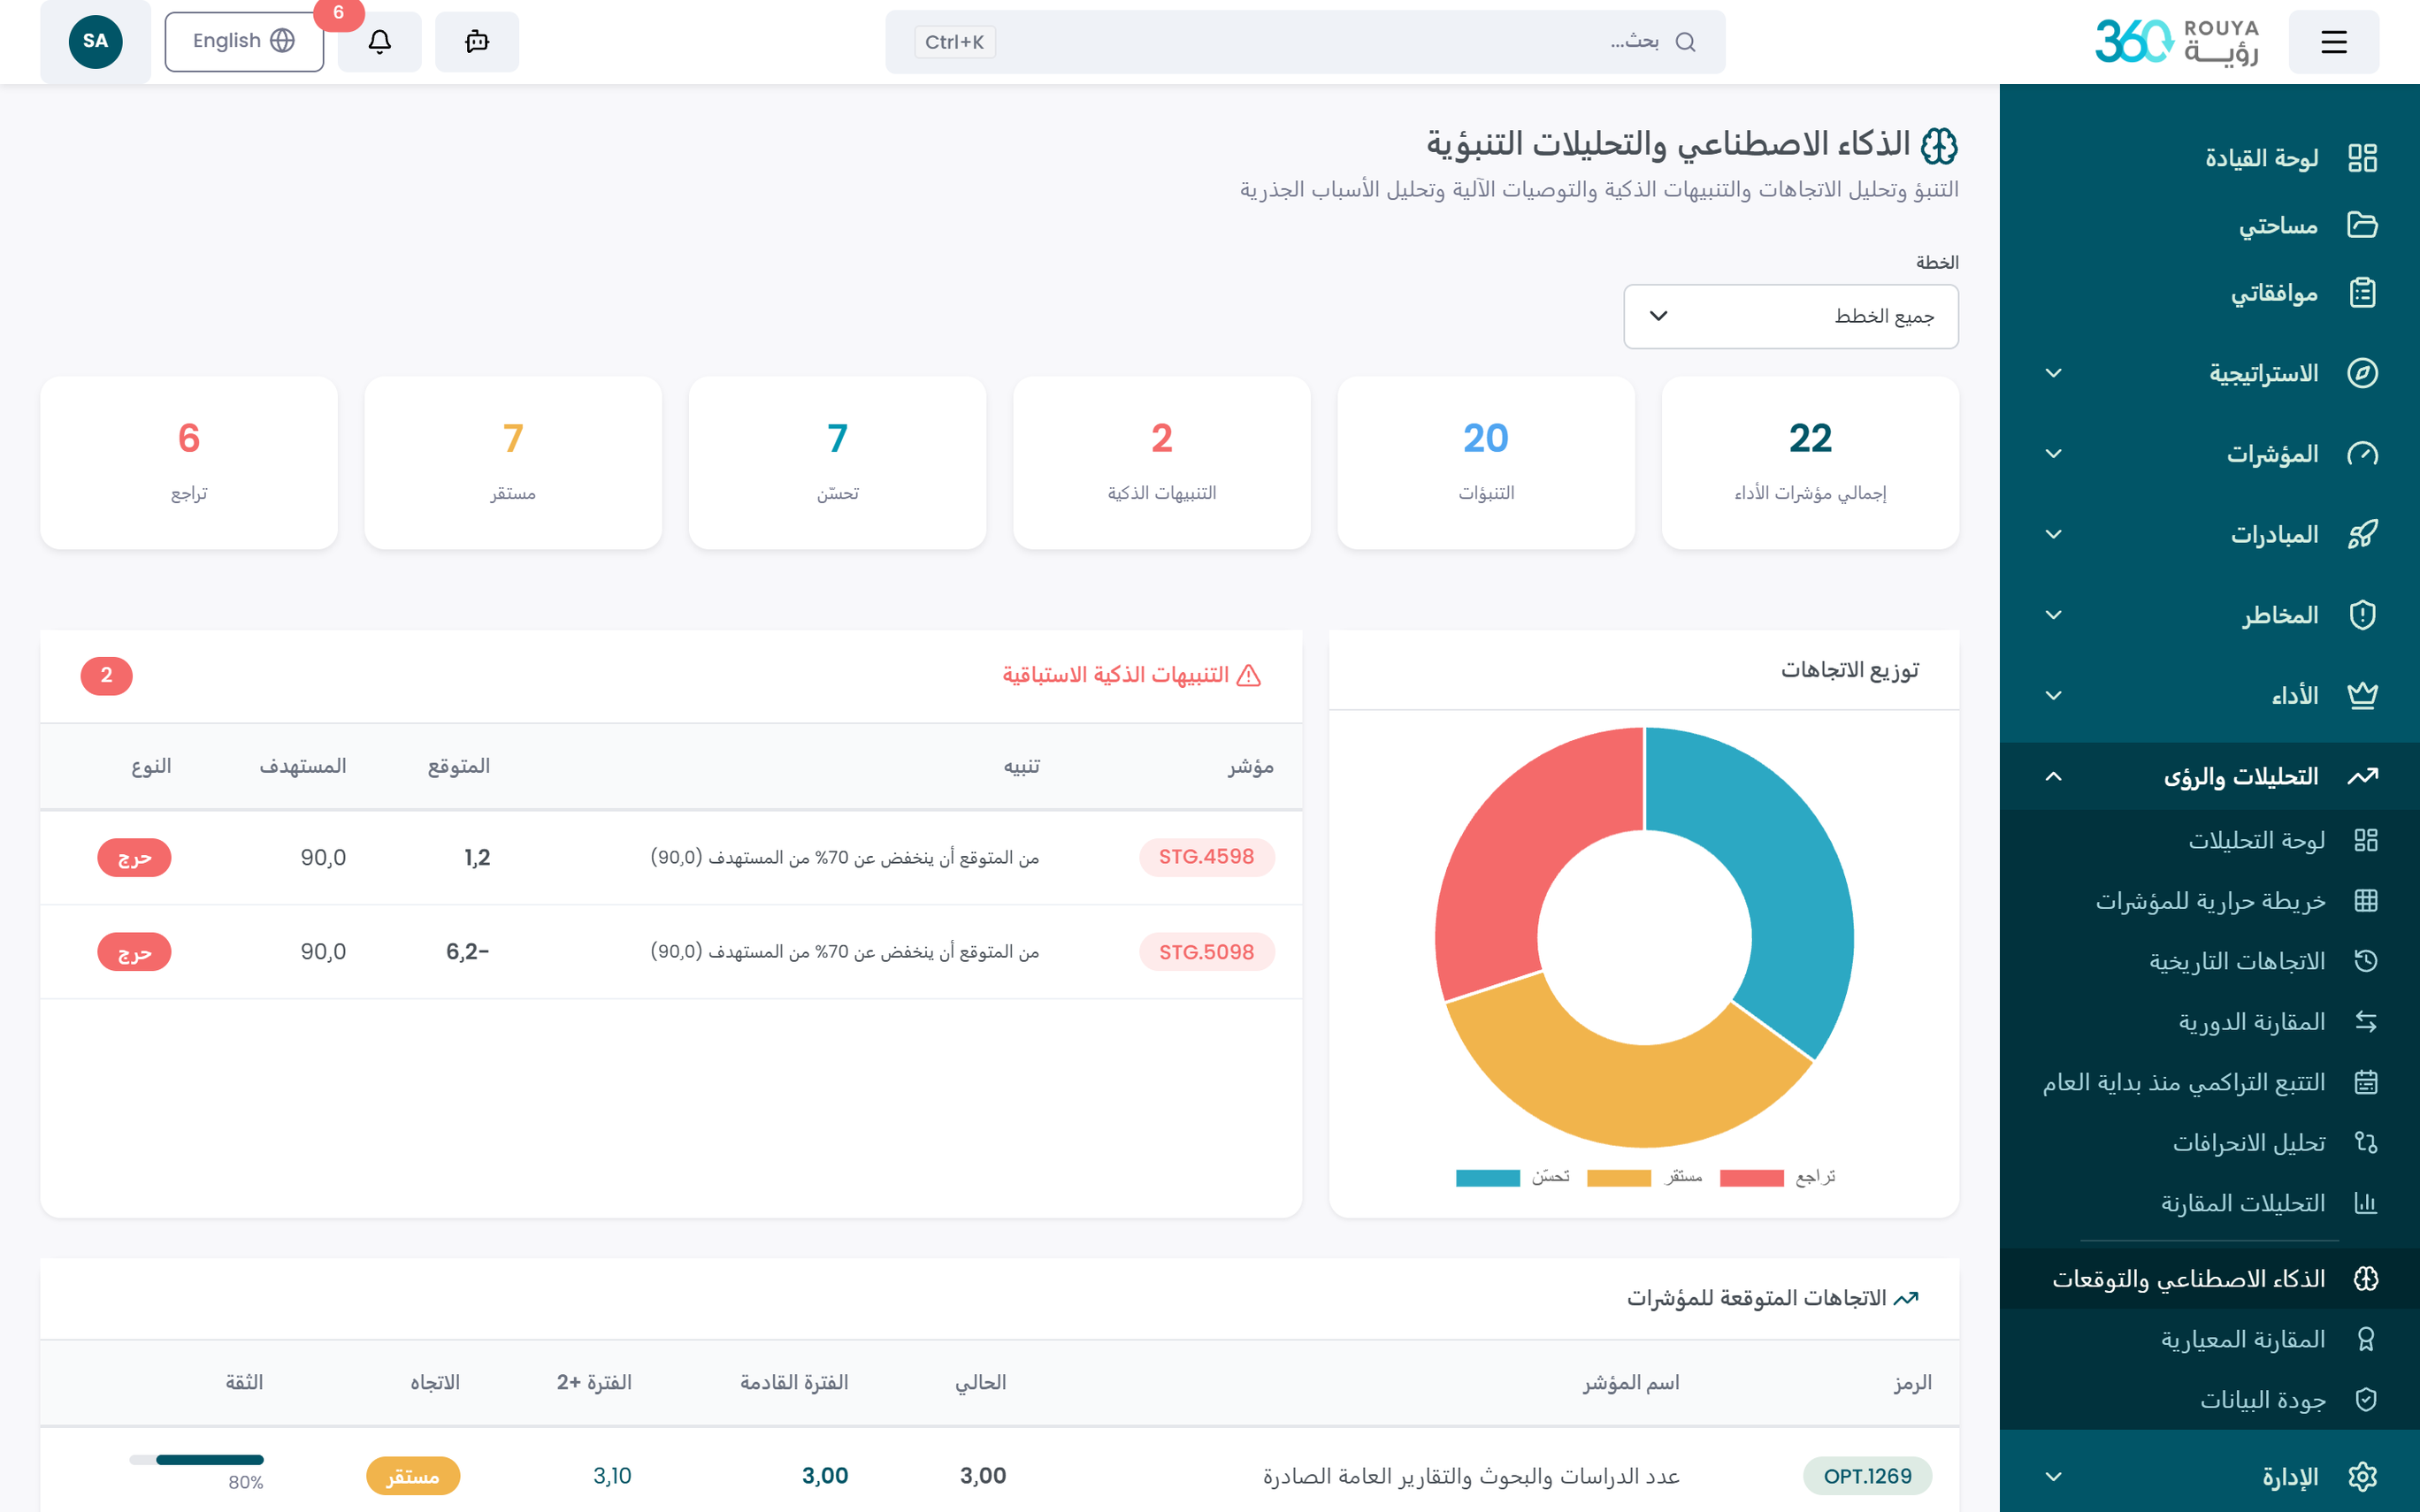
AI Analytics & Benchmarking
Predictive analytics forecast KPI trajectories before annual targets are missed. Automated gap analysis surfaces the highest-impact performance shortfalls. Root-cause analysis links underperformance back to operational processes and risks. AI-generated recommendations guide corrective action. National and international benchmarking places your performance in context against peers and best practices.
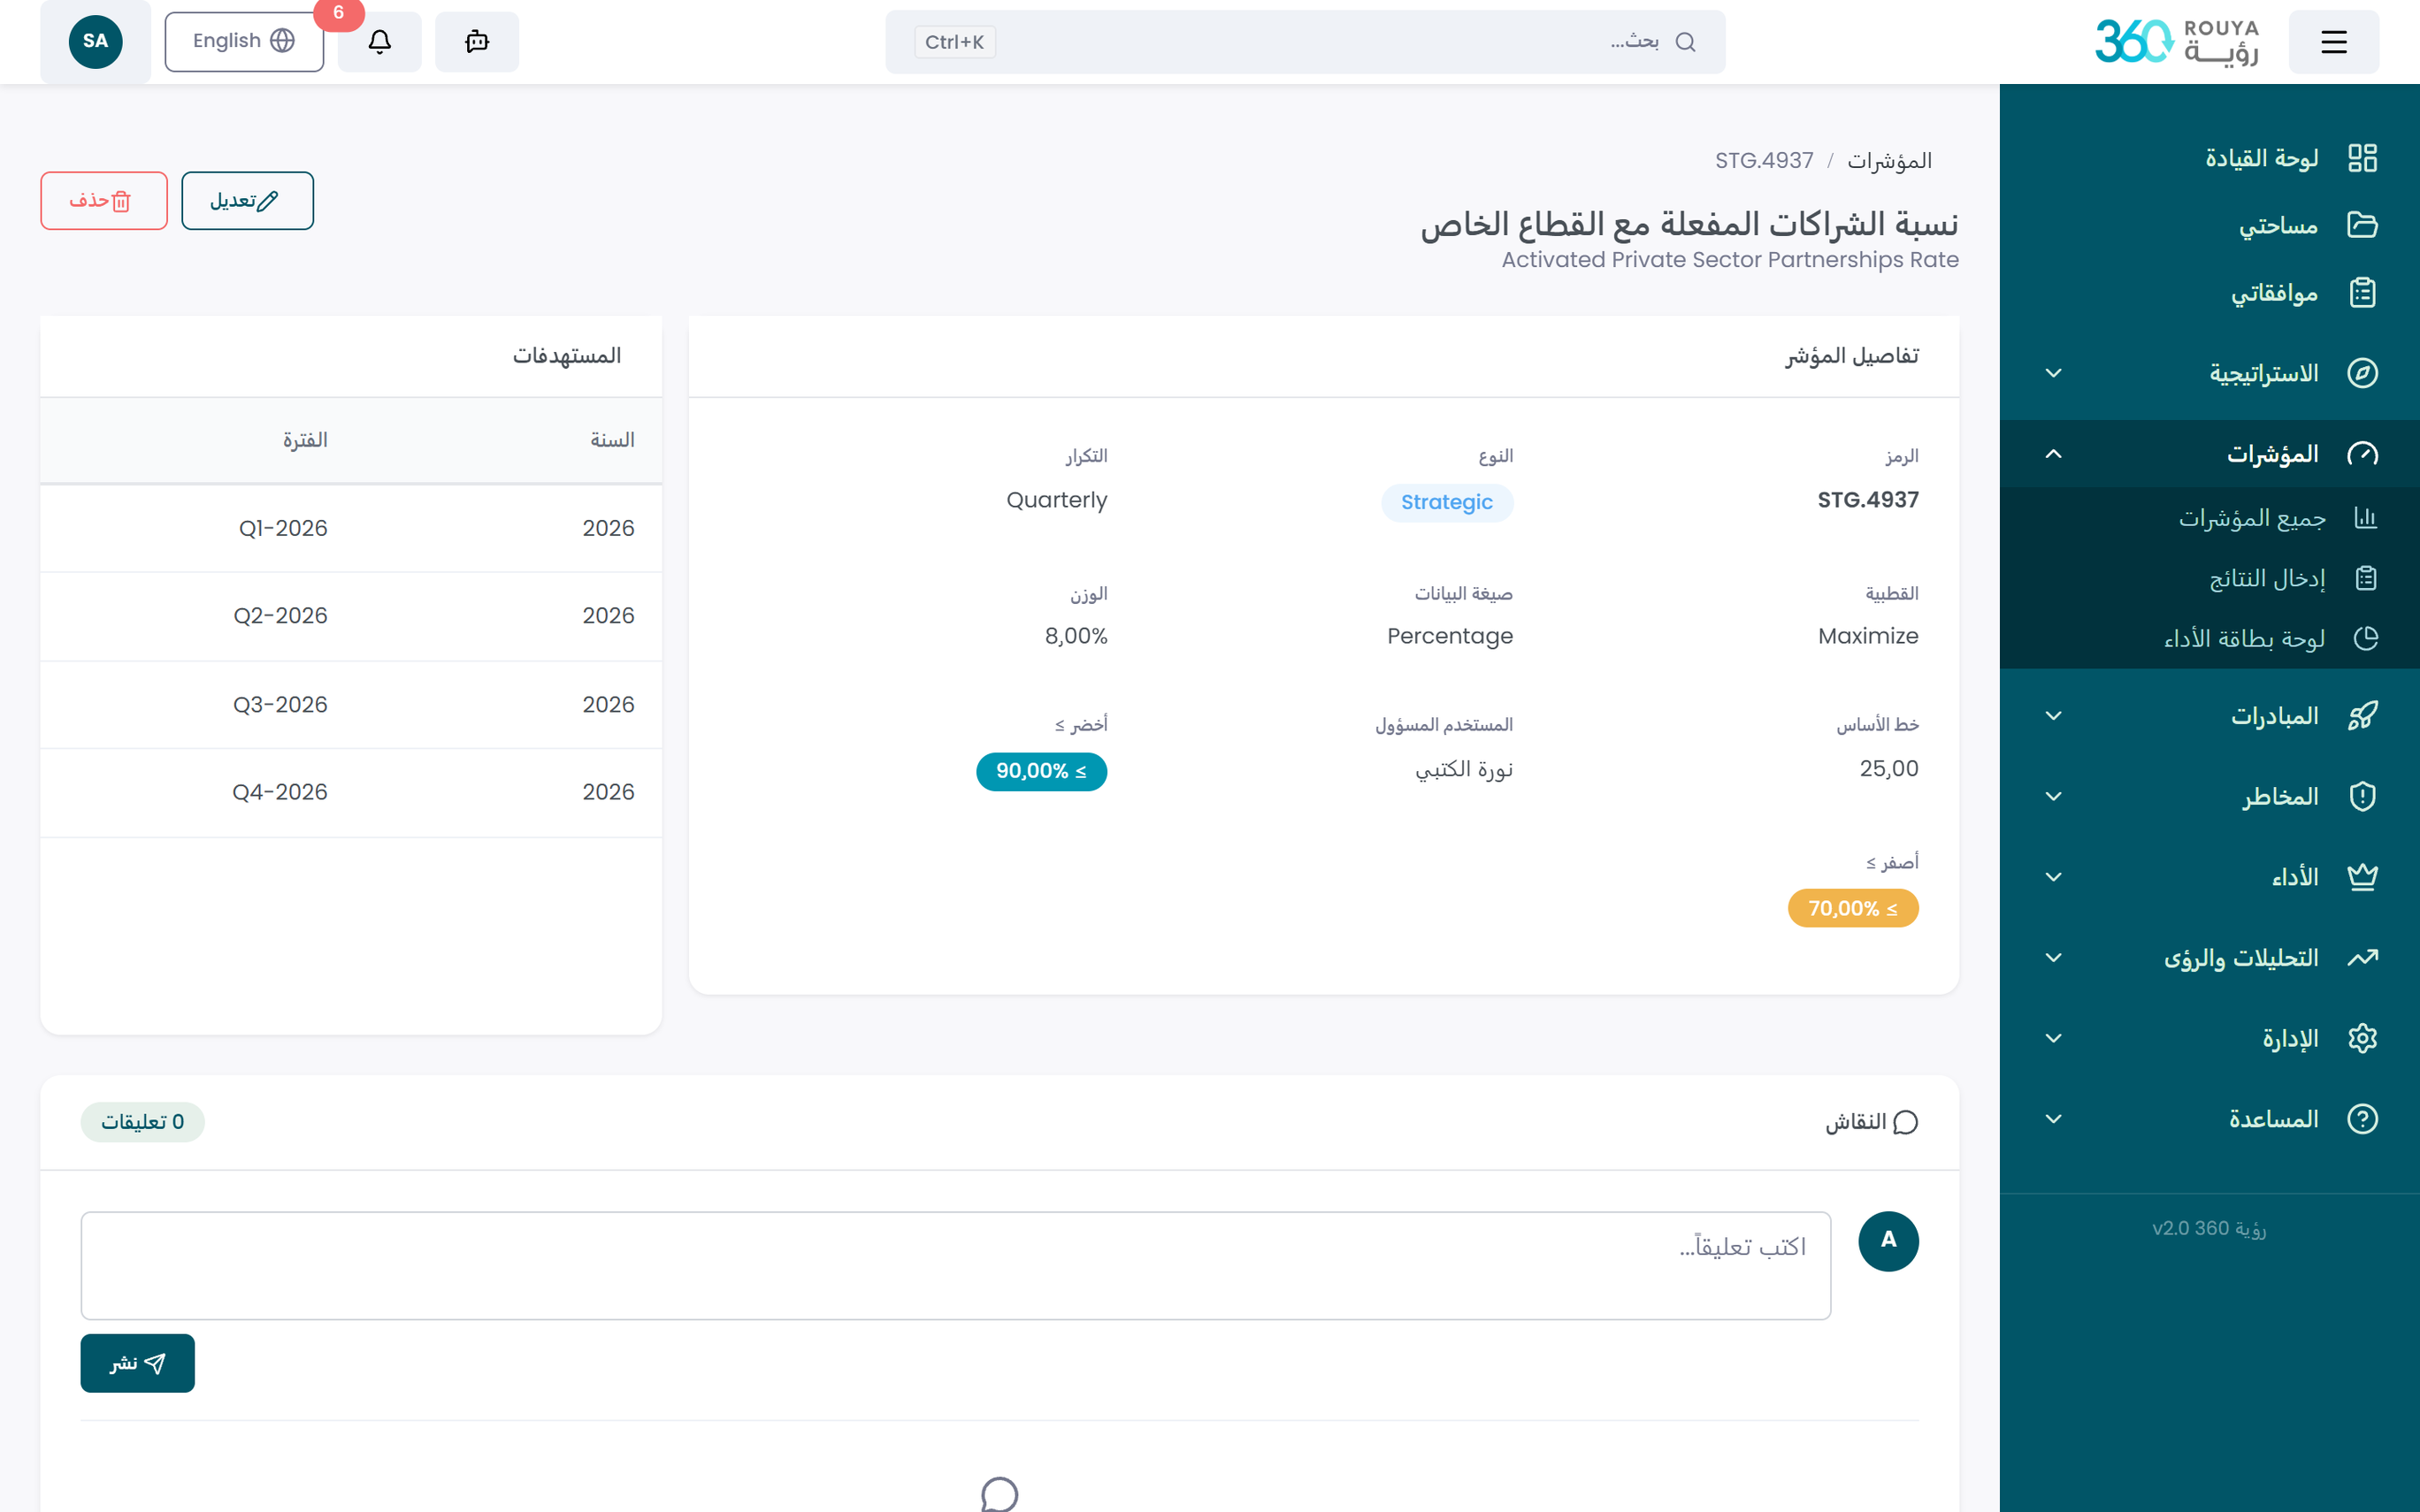
The Most Complete
Indicator Card
Each KPI carries a full metadata profile — not just a number, but context, ownership, quality standards, and strategic linkage.
- ✓Unique ID, Bilingual Name & FormulaEvery indicator has a system code, measurement formula, data type, and full description in both languages.
- ✓Polarity & Target RangeSet to Maximize, Minimize, or a balanced optimal range — for indicators like response time that have an ideal band, not just a ceiling.
- ✓Composite IndicatorsBuild KPIs composed of multiple sub-indicators using custom formulas, logical conditions, and relative weights.
- ✓Source-Aware Data EntryTag each indicator with its data source — manual entry, file import, or API integration — so teams always know where the number came from.
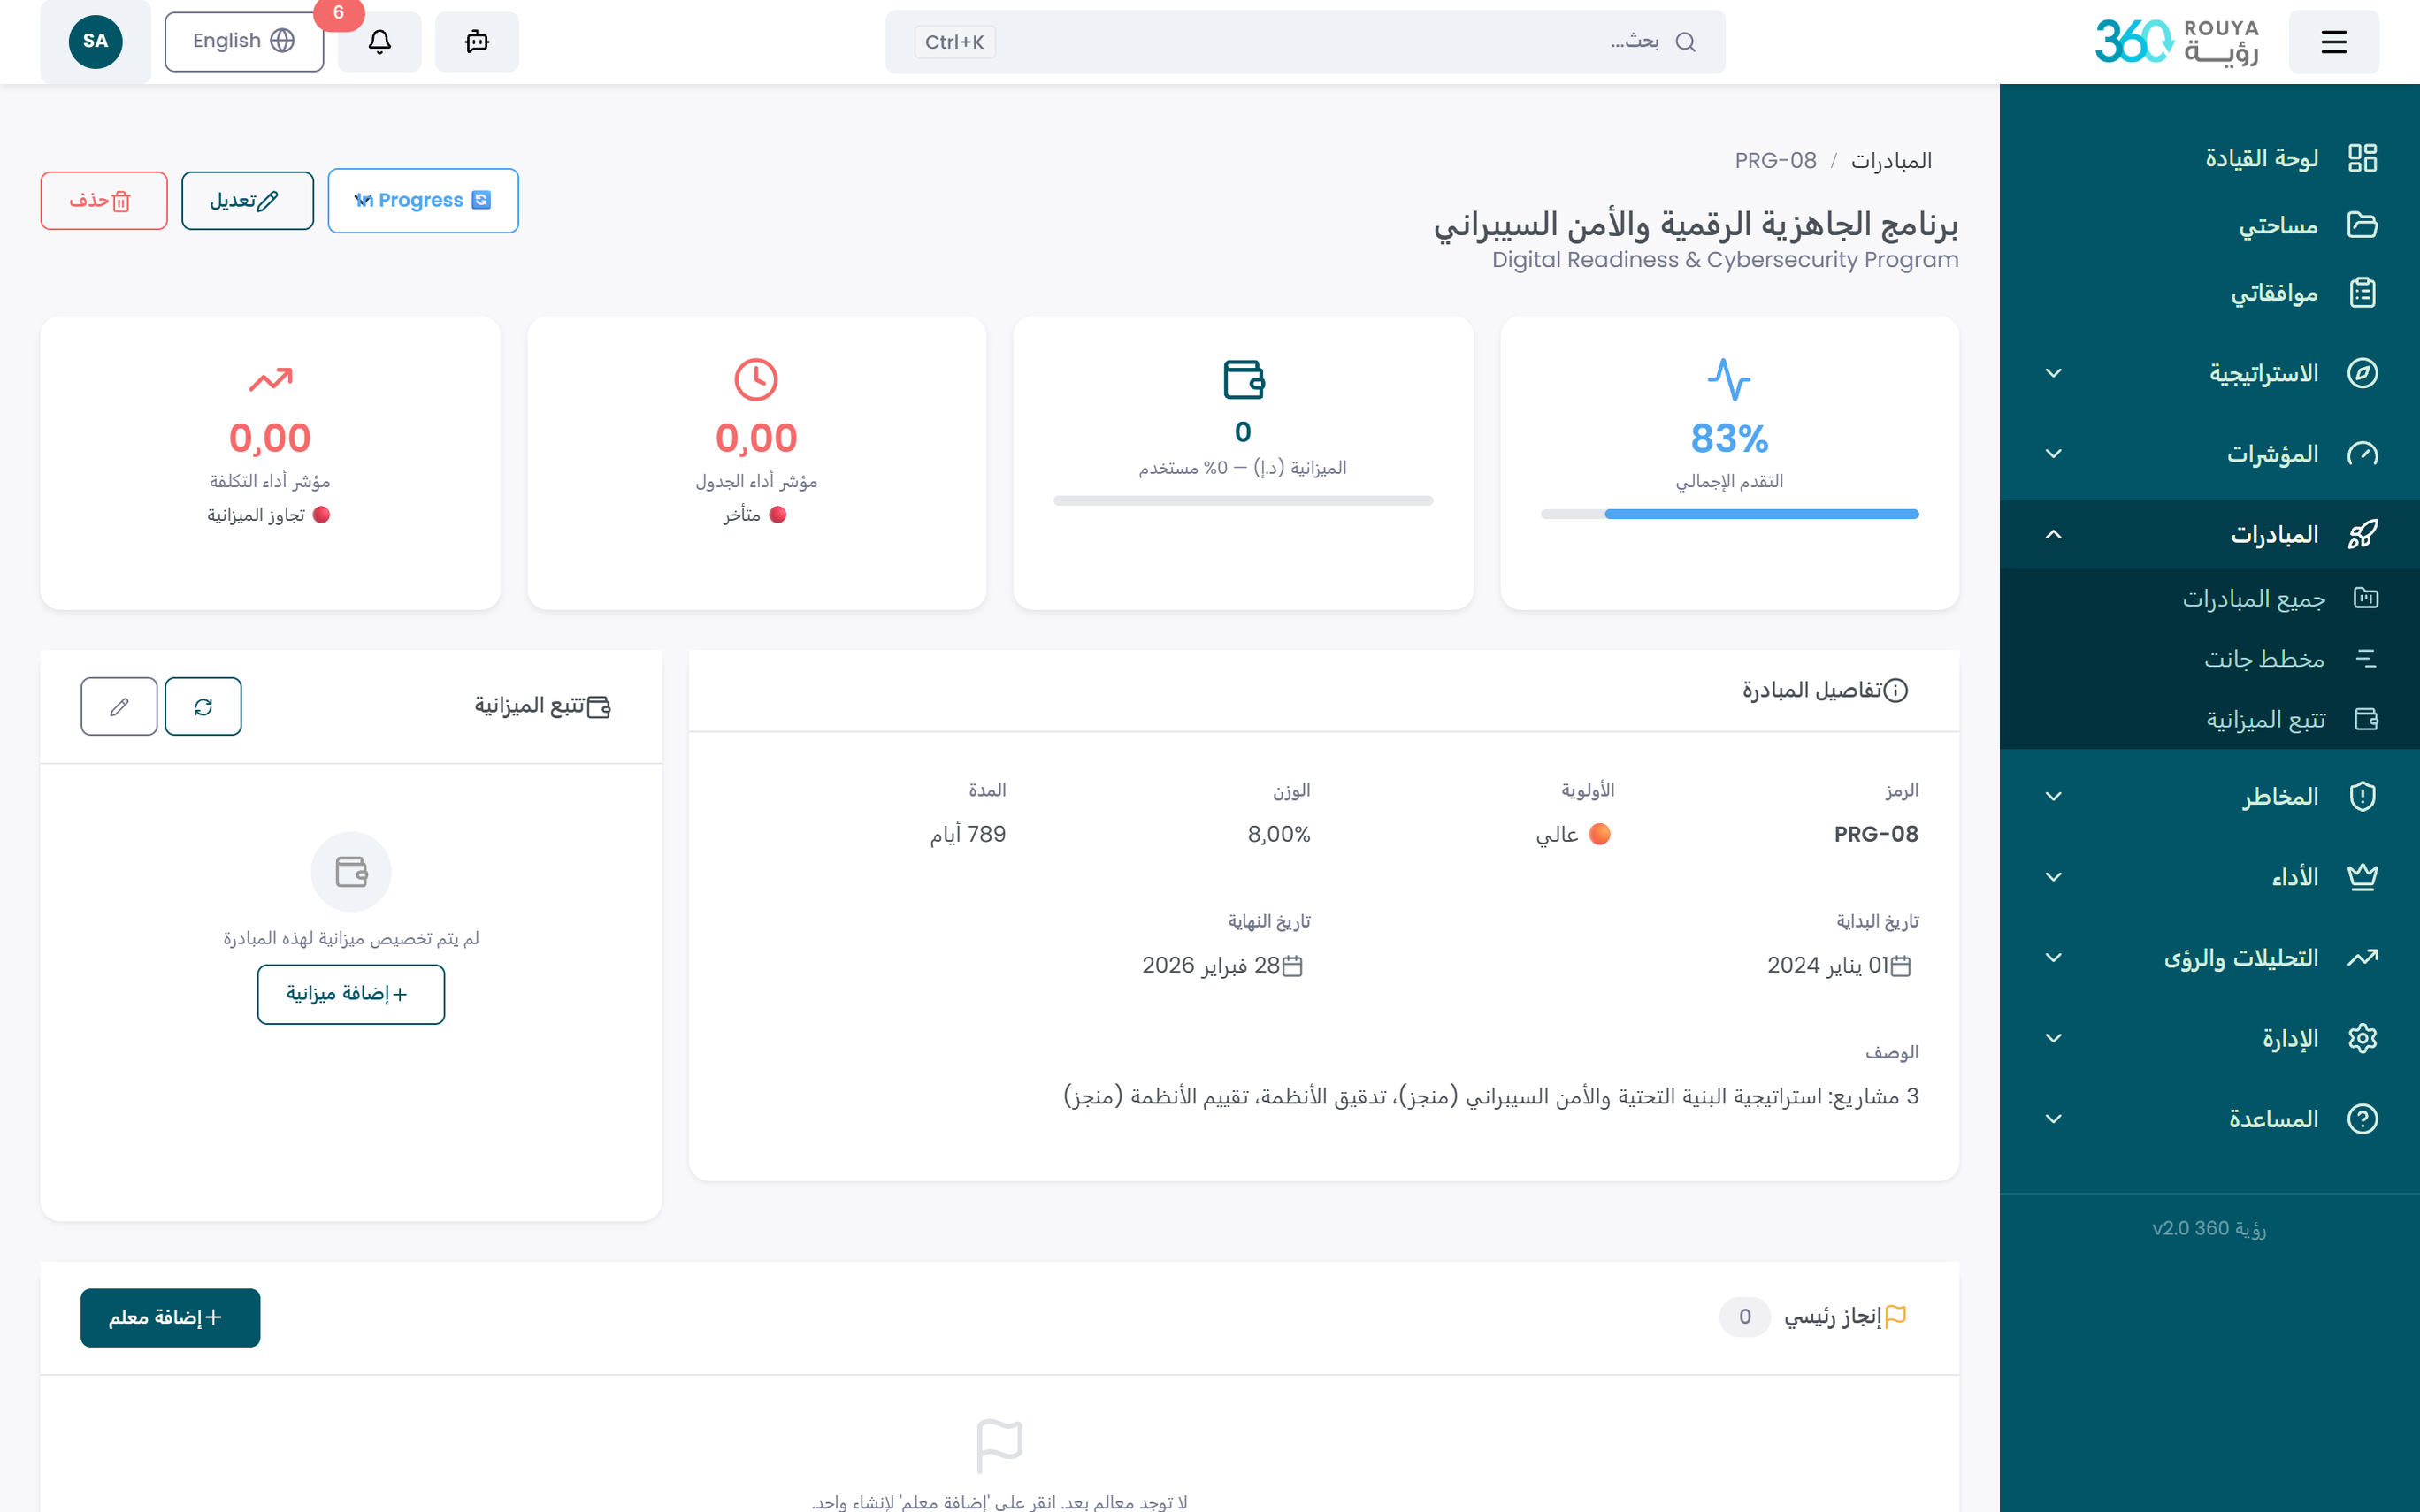
From Plan to
Delivery
Complete project management built into the strategy system — timeline, budget, dependencies, obstacles, and corrective actions all in one place.
- ✓Interactive Gantt with Critical PathVisualize the full project schedule, flag critical-path tasks, and see which tasks are blocking delivery.
- ✓Budget vs. Actual MonitoringTrack allocated budget against real spend — with automatic alerts as initiatives approach their financial limits.
- ✓Obstacle & Corrective Action LoggingRecord challenges encountered and the actions taken, creating an accountable delivery history for every initiative.
- ✓Structured Change RequestsRequest new initiatives, add or modify KPIs, or revise targets through governed approval workflows with full tracking.
Score Every Layer of
Your Organization
Six calculation methods, custom formula support, and cascading weighted scores — from individual KPIs to the full strategic plan — computed in real time.
① KPI-Based
Targets achieved ÷ total targets × weights
② Initiative-Based
Initiatives achieved ÷ total initiatives × weights
③ Blended (50 / 50)
50% KPI score + 50% initiative score — the most balanced approach
④ ⑤ Average Ratio Methods
Weighted average of all achievement percentages for KPIs or initiatives
⑥ Custom Formula Builder
Define your own scoring logic with custom weights, conditions, and combinations
Stay Ahead of
Every Deadline
Rouya 360 pushes the right alert to the right person at the right time — before deadlines, not after them.
- ✓Early Warning Before DeadlinesConfigurable lead-time alerts notify data owners before KPI measurement windows close — eliminating last-minute scrambles.
- ✓Budget & Risk Threshold AlertsInstant notifications when initiative budgets exceed thresholds or when risk scores cross defined limits.
- ✓Auto-Scheduled Leadership ReportsMonthly or quarterly performance digests generated and sent automatically to responsible officers.
- ✓Multi-Channel DeliveryAll notifications available via email and the in-system notification center — each user configures their own preferences.
Platform Foundations
Core architectural capabilities that make Rouya 360 the right choice for complex, multi-stakeholder government strategy environments.
Fully Bilingual
Complete Arabic & English with RTL layout and regional number formatting throughout.
Open Integration Layer
Classify every indicator's data source (manual, imported, or API) and integrate with operational systems via REST endpoints.
Governed Approvals
Multi-level review and endorsement workflows with a full, tamper-proof audit trail for every action.
Multi-Plan Architecture
Run multiple specialized strategic plans simultaneously with shared KPIs and cross-plan comparison.
Role-Based Security
Data-level permissions, delegation mechanisms, activity logs, and SSO / Active Directory integration.
National Plan Alignment
Link every goal directly to national agendas, government frameworks, and sectoral strategies.
Flexible Scoring Engine
Six built-in methods plus a custom formula builder — weight validation and cascading aggregation included.
End-to-End Traceability
Every KPI, initiative, risk, and process is connected — trace any performance result back to its source.
Strategy to Results
in 6 Steps
A clear, governed pathway from strategic intent to measured organizational outcomes.
Define Your Strategy
Build the full strategic hierarchy — Vision, Mission, pillars, goals, and sub-goals — linked to national frameworks and partner entities, in both English and Arabic.
Design KPIs & Set Targets
Create comprehensive KPI cards with formulas, ownership, benchmarks, and measurement cycles. Set targets manually or generate them automatically using growth rules and benchmark references.
Register Initiatives & Budgets
Build initiative plans with Gantt timelines, task dependencies, budget allocations, and deliverables — linked directly to the strategic goals they serve.
Collect, Validate & Approve Data
Data owners enter actuals with justifications. Results flow through governed approval workflows before being formally recorded — with a full audit trail at every step.
Monitor Performance in Real Time
Scores cascade from KPI level to strategic pillar to overall plan. Color-coded executive dashboards alert leadership to what needs attention — instantly and clearly.
Analyze, Report & Improve
Generate executive reports, leverage AI-driven predictive insights, conduct gap and root-cause analysis, and drive continuous improvement with automated recommendations.
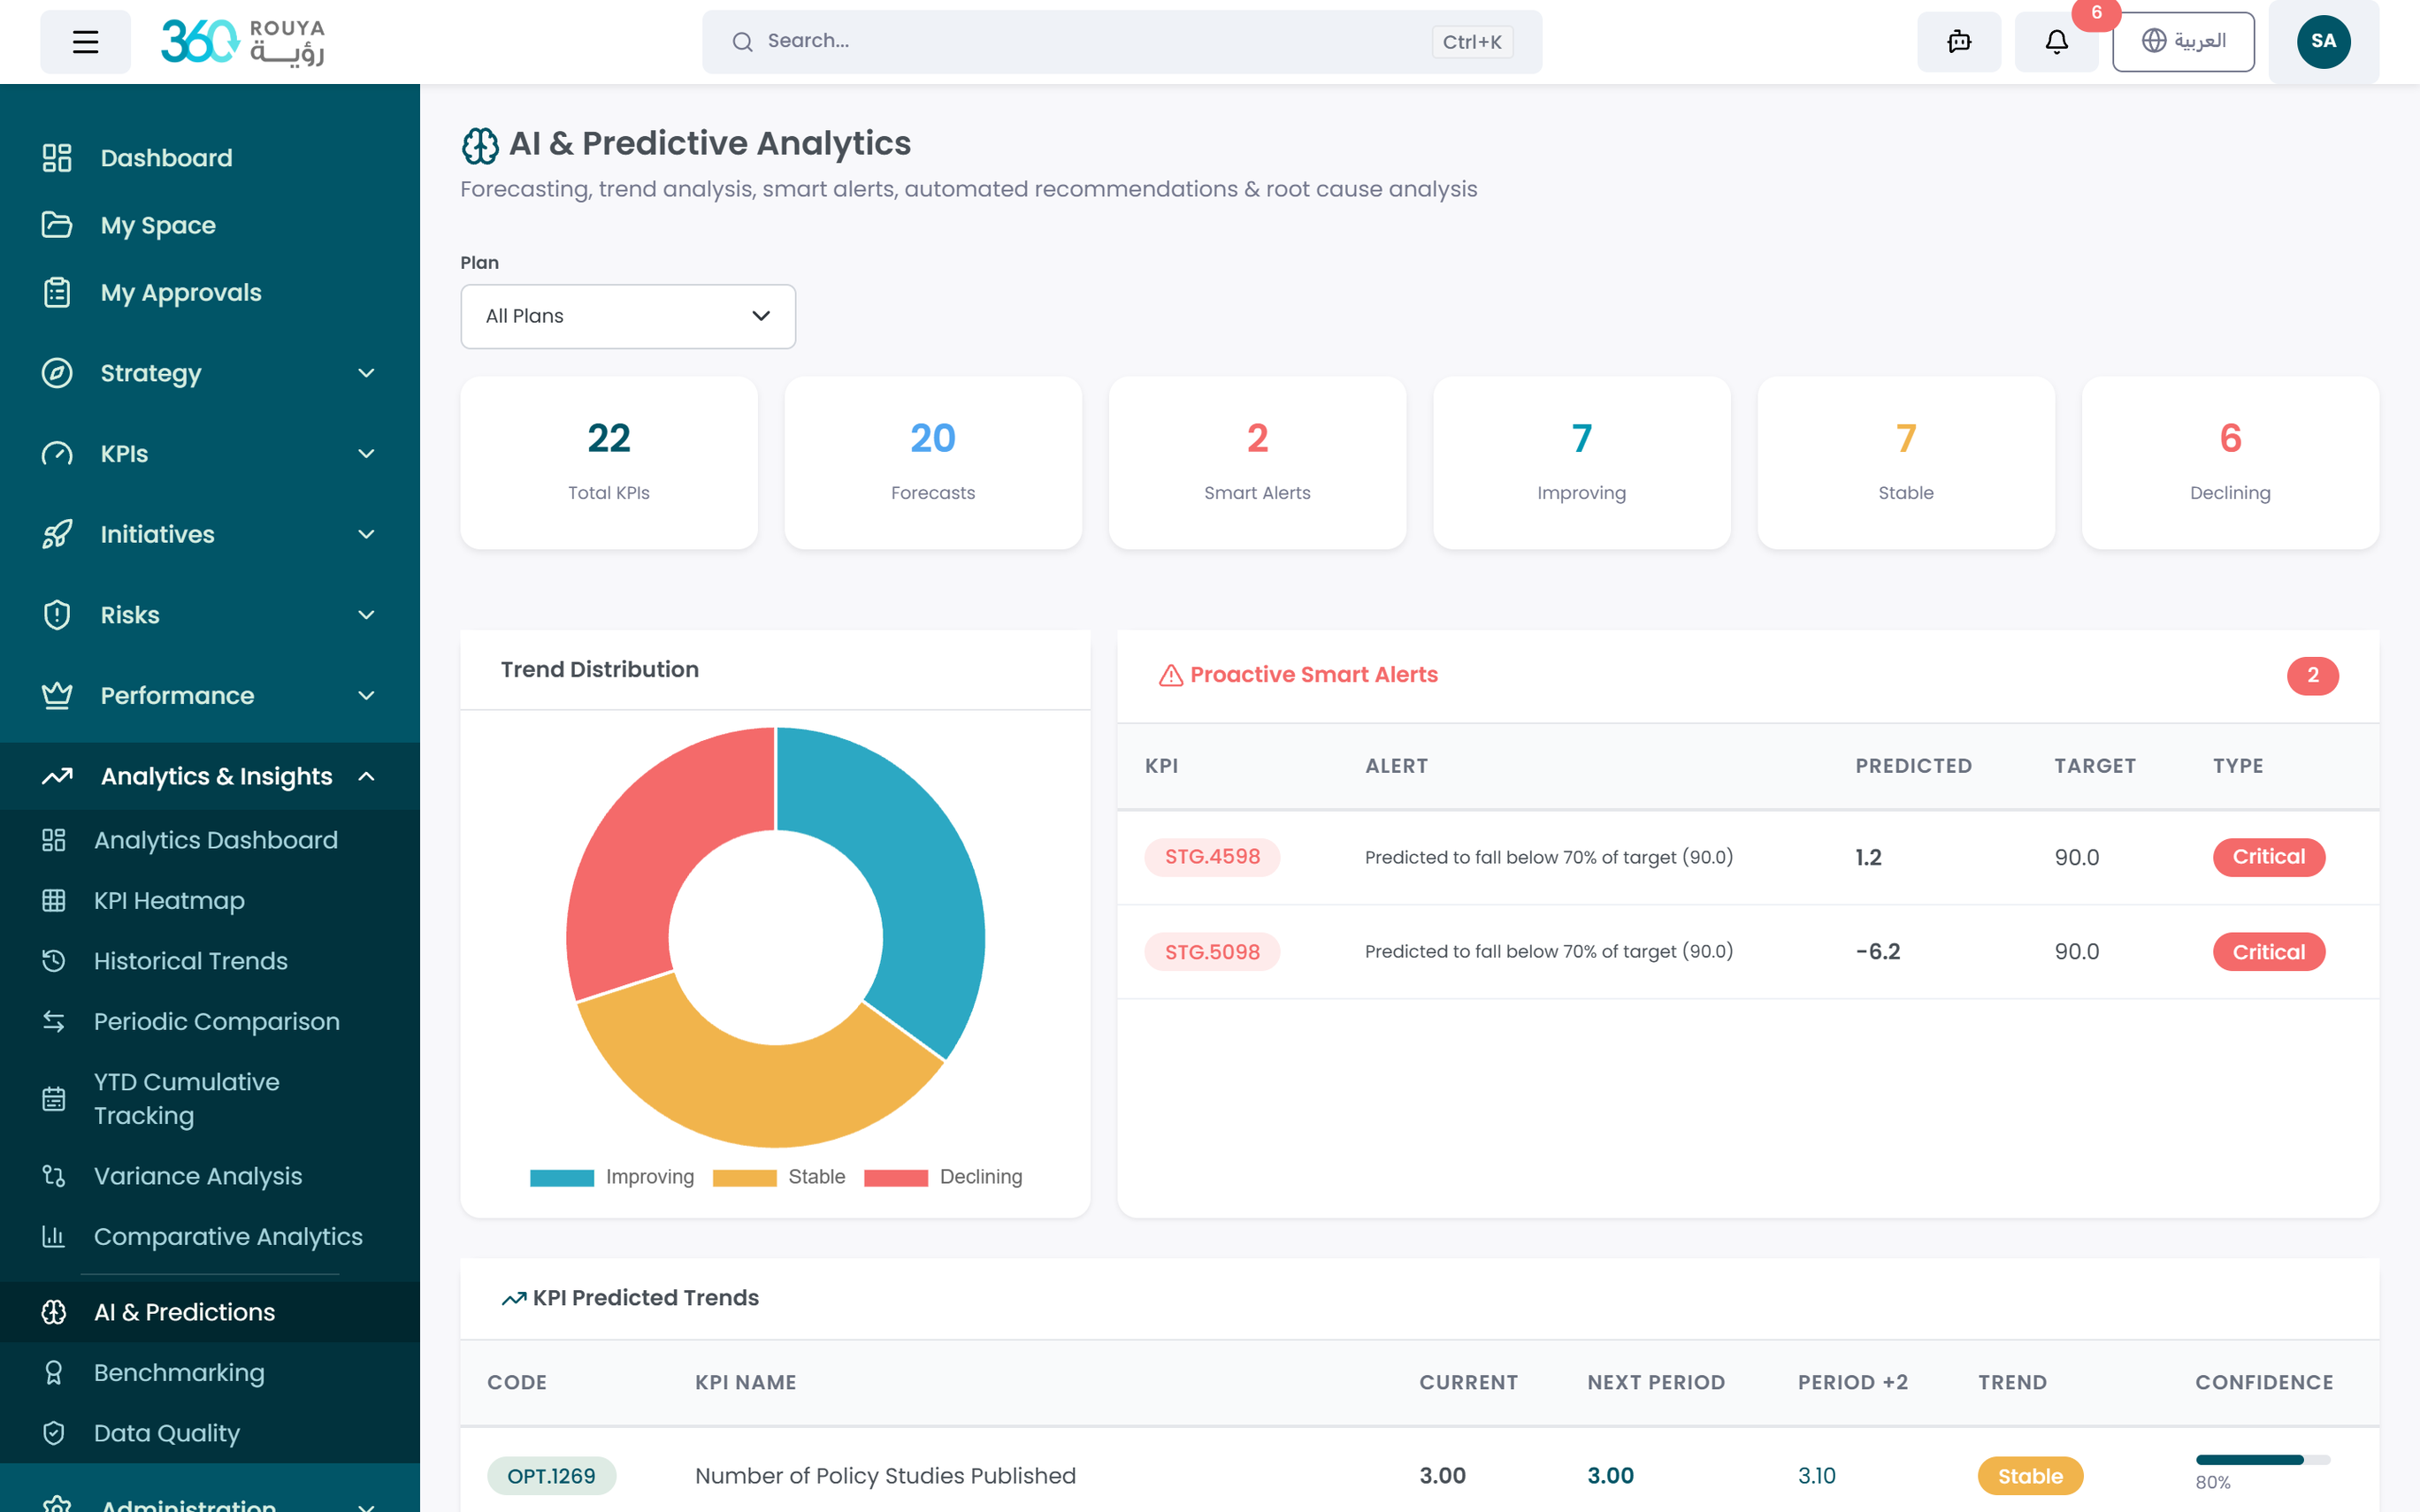
AI That Works for
Your Strategy
Beyond tracking — Rouya 360 helps your organization understand why performance is where it is, and what to do next.
Predictive, Prescriptive,
Proactive
The AI layer transforms raw performance data into forward-looking guidance that leadership can act on immediately.
Predictive Analytics
Forecast KPI trajectories before annual targets are missed
Gap Analysis
Surface high-impact performance shortfalls automatically
Root Cause Analysis
Link under-performing KPIs to their registered risks
AI Recommendations
Auto-generated improvement actions with priority levels
Benchmarking
Compare against national & international standards
Trend Detection
Classify every KPI as improving, stable, or declining
See Rouya 360 in Action
Request a personalized demo and discover how Rouya 360 transforms strategy management for your organization.